XPeng Motors shows a divergence between technical indicators and market sentiment; short-term rebound targets the 63.7 yuan level.
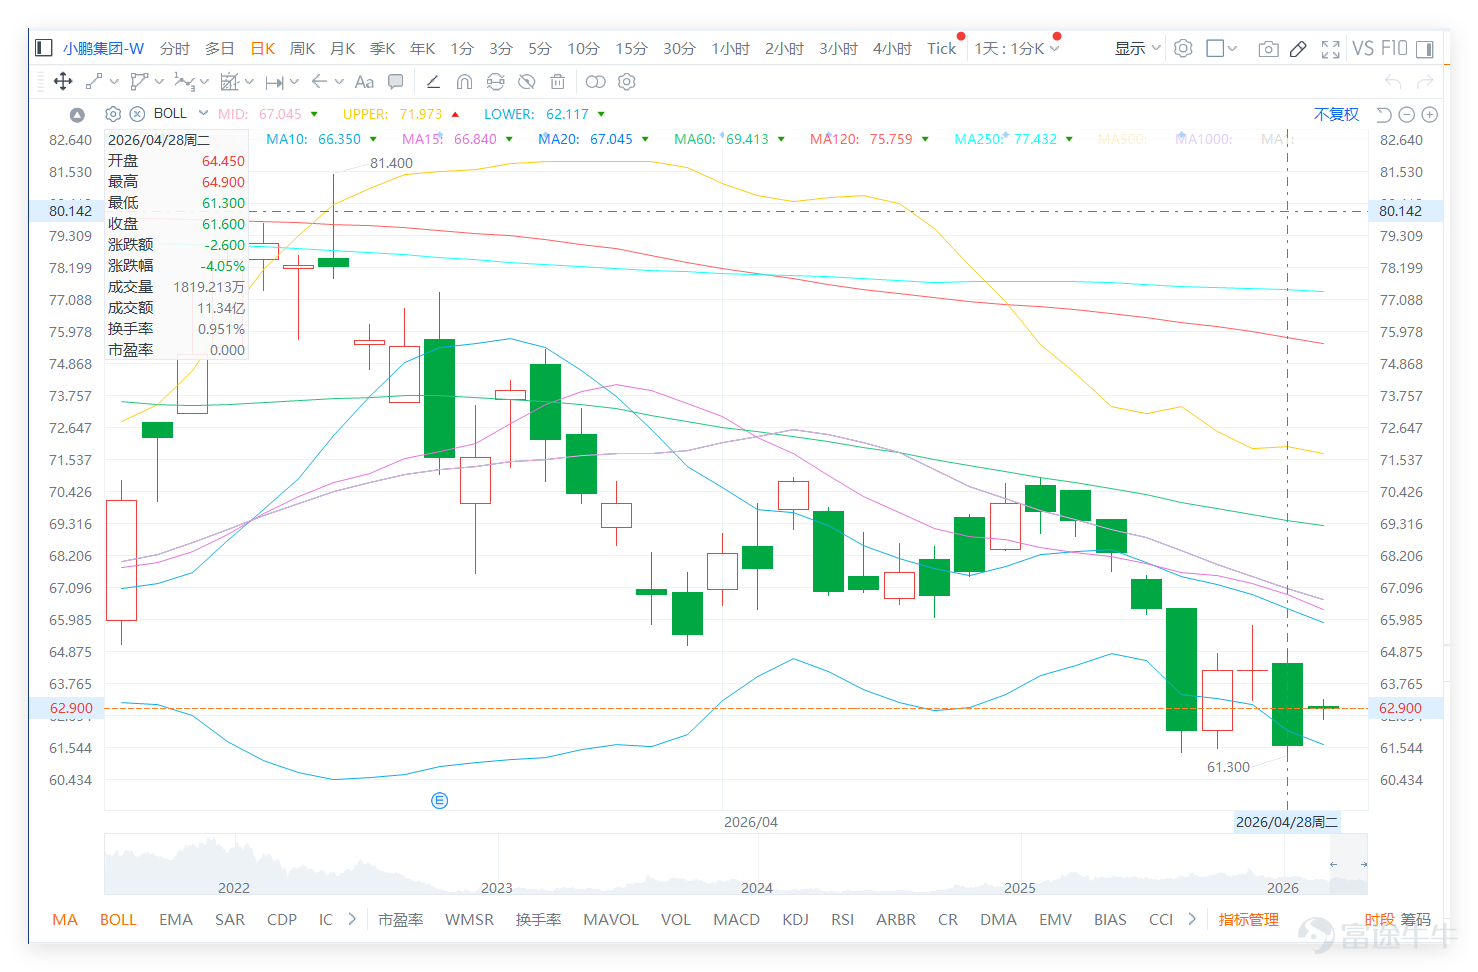
The closing price on the previous day (28th) was 61.60 yuan, with a single-day decline of 4.05%. In terms of moving averages, its MA10 was 66.35 yuan, MA30 was 69.57 yuan, and MA60 was 69.41 yuan.

Looking at the automobile manufacturer sector, the market generally fell the previous day. $GWMOTOR (02333.HK)$ A 4.58% drop for one stock, XPeng Motors fell by 4.05%, $LI AUTO-W (02015.HK)$ A 3.87% drop, $NIO-SW (09866.HK)$ A 3.73% drop, $GAC GROUP (02238.HK)$ A 3.32% drop, $GEELY AUTO (00175.HK)$ A 2.68% drop, $BYD COMPANY (01211.HK)$ A 2.17% drop.
However, there is a significant divergence in technical signals: despite the widespread decline in stock prices, the technical indicator summary signal for XPeng Motors is 'Buy,' with a signal strength of 9 (Strong Buy). Meanwhile, the technical signals for Li Auto, BYD, Great Wall Motors, and GAC Group are also 'Buy,' while only Nio and Geely Auto are 'Neutral.' This indicates that XPeng's weak decline occurred amidst an overall sector adjustment, but the technical ratings for most stocks (including XPeng itself) remain highly positive. This 'price drop with strong buy signal' divergence usually suggests that short-term downward momentum may weaken, with a strong intrinsic demand for a technical rebound. However, the trigger and sustainability of the rebound still need to be confirmed by a recovery in market sentiment and capital inflow.

The sentiment in XPeng Motors' community posts is notably bearish, with market attention focused on three key points:
First, whether the stock price will fall below 60 yuan;
Second, whether insufficient liquidity could lead to continued gradual declines;
Third, whether concepts like robotics and Robotaxi can re-support valuations.
Overall, investors are still discussing fundamental themes, but short-term trading sentiment is clearly weak.
Many posts mention 'breaking 60,' 'new lows,' 'three black crows,' and 'the start of a slow decline,' reflecting a lack of confidence in the short-term trend. Even investors who are optimistic about XPeng's technology and long-term growth tend to take smaller positions to accompany the growth rather than aggressively buying in large quantities immediately.
Technically, XPeng's closing price on the previous day (August 28) at 61.600 was already below the 5-day, 10-day, 20-day, 30-day, and 60-day moving averages, indicating a clear short-term weakness. Additionally, 61.600 broke below the lower Bollinger Band at 62.117, showing continued selling pressure. The Relative Strength Index (RSI) stands at 26.703, nearing the oversold zone, but being oversold doesn't necessarily mean an immediate rebound — a recovery above 62.117 is needed for a technical rebound.
In terms of short-term strategy, only by breaking back above 62.117 does the stock have a chance to retest 63.690. If it fails to reclaim 62.117, then we need to watch for another test of 60.350, or even the psychologically important level of 60 yuan. At this stage, the risk-reward ratio is low, making it more suitable to wait for stabilization signals before making further judgments.
Reply to some investors' views:
@旺旺仙貝旺旺仙貝 After buying, you should exit as soon as you make a profit; don't wait.
For this type of high-volatility stock, scaling out of positions is more prudent than holding stubbornly.
@天霸地霸duang Volume has dried up, signaling the start of a new round of slow declines.
Insufficient trading volume is indeed unfavorable for a rebound; let’s first see if it can regain 62.117.
@巴菲兔 Unfortunately, it just didn't perform well
The stock price has fallen below multiple moving averages, showing clear short-term weakness.
Based on the above analysis, the strategies for deployment can be divided into the following main approaches:
Key deployment: XPeng Motors has fallen below 62.117, and without regaining this level, confirmation of a rebound is insufficient. If 62.117 is reclaimed, a technical rebound may be possible; only by breaking above 63.690 will the conditions for a sustained rally emerge. Otherwise, one should remain cautious about a potential retest of 60.350.
Strategy One | Reclaim 62.117 to bet on a rebound
$UBXPENG@EC2705A.C (26837.HK)$ | Strike price 78.93 | Actual leverage 2.5x | Lower leverage, suitable for an initial rebound after oversold conditions with higher volatility tolerance
$CIXPENG@EC2705A.C (25535.HK)$ | Strike price 78.88 | Actual leverage 2.8x | Slightly higher flexibility, ideal for following up on rebounds after the stock price regains the pivotal level
$BIXPENG@EC2610A.C (25629.HK)$ | Strike price 80.00 | Actual leverage 3.7x | More aggressive, suitable for capturing upside towards 63.690 once a rebound is confirmed
Strategy Two | Break above 63.690 to chase extended rebound
$BIXPENG@EC2610A.C (25629.HK)$ | Strike price 80.00 | Actual leverage 3.7x | Suitable for chasing short-term extensions after breaking resistance, with quicker reaction
$HUXPENG@EC2610A.C (26690.HK)$ | Strike price 80.05 | Actual leverage 3.9x | Higher flexibility, suitable for more aggressive positions after a breakout
$UBXPENG@EC2705A.C (26837.HK)$ | Strike Price 78.93 | Actual Leverage 2.5x | Relatively balanced, suitable for those looking to chase a rebound but unwilling to endure high volatility
Strategy Three | Bearish if 62.117 is not reclaimed
$UBXPENG@EP2608A.P (23599.HK)$ | Strike Price 61.88 | Actual Leverage 2.5x | Close to current price, suitable for capturing downside towards 60.350 in a continued weak trend
$HUXPENG@EP2612A.P (23272.HK)$ | Strike Price 60.00 | Actual Leverage 2.0x | Lower leverage, suitable for conservative plays expecting a pullback
$CIXPENG@EP2608A.P (23729.HK)$ | Strike Price 58.88 | Actual Leverage 3.0x | Higher flexibility, suitable for short-term bearish positions amid an accelerating downtrend
For more market analysis, stay tuned to Jenny's daily updates on 'Hong Kong Stock Warrants'!
Reminder: This article does not constitute any investment advice.
This article is for reference only and does not constitute any investment advice. The market data, opinions, and analysis contained herein may change at any time without prior notice. We are not responsible for any loss or damage caused by reliance on the information in this article. Technical analysis only shows whether certain technical conditions are met; a comprehensive assessment of asset performance should be conducted using additional data. Decisions to trade should not be based solely on this article. Please note that past performance is not indicative of future results.
#HKStocks #Xiaopeng #AutoStocks #Real-TimeAnalysis #WarrantPick #WarrantGuide #DerivativesHedging #HKWarrantsJenny #Blue-ChipStocks #TechnicalAnalysis
Risk Disclaimer: The above content only represents the author's view. It does not represent any position or investment advice of Futu. Futu makes no representation or warranty.Read more

Comments
to post a comment
2