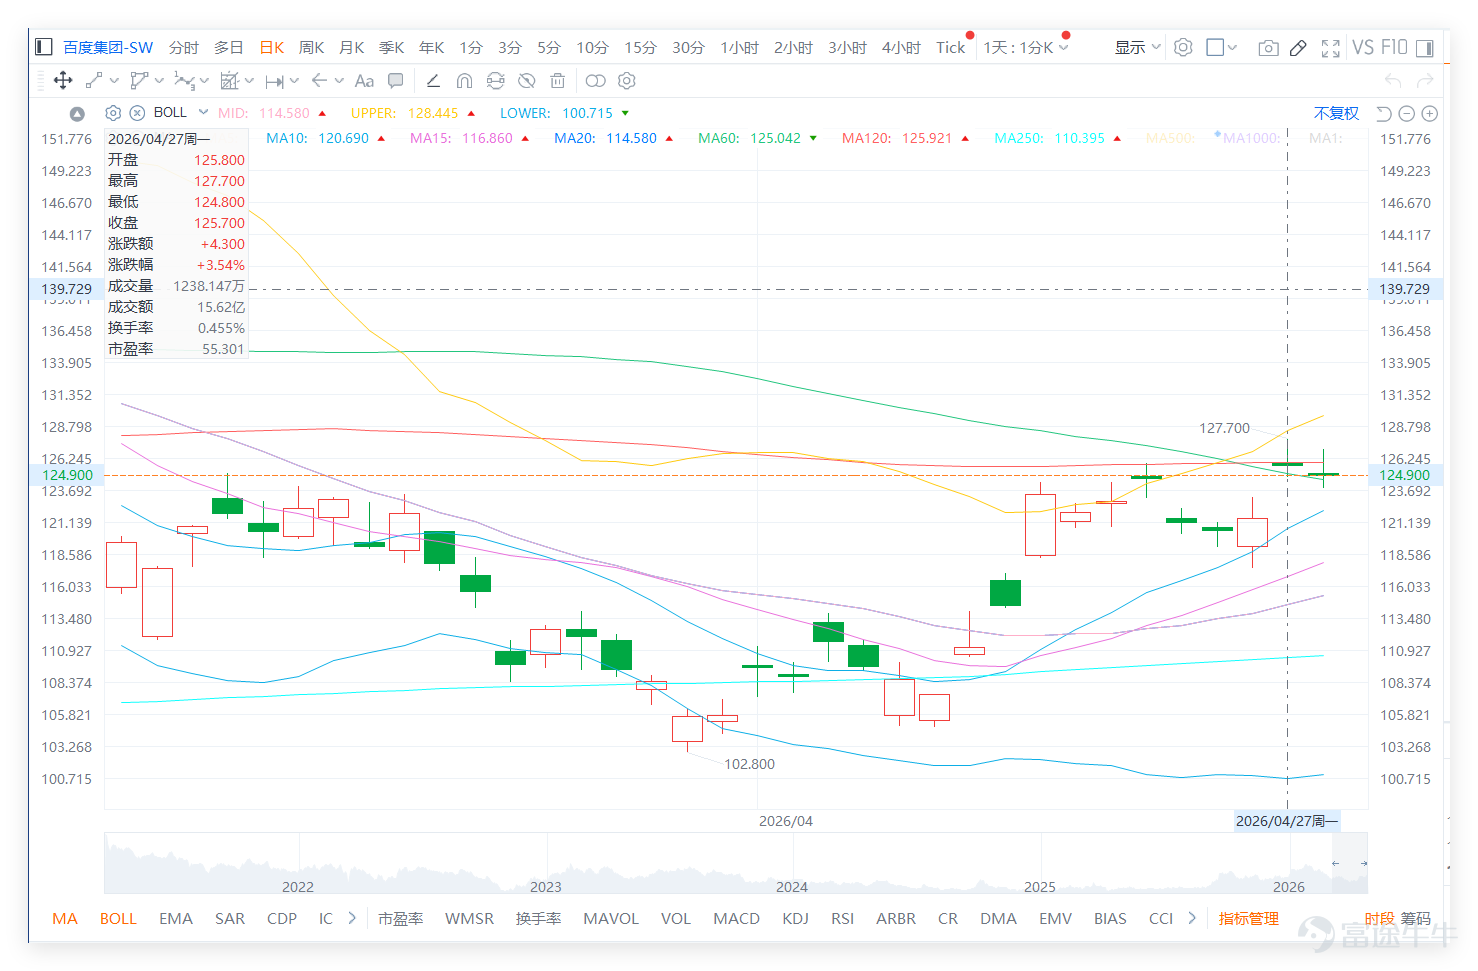

Baidu is caught in a dilemma of independent strength and technical divergence, with short-term focus on the support at 125 yuan
Looking at the internet technology sector, the market performance was mixed on the previous day (the 27th). $BIDU-SW (09888.HK)$
It rose 3.54%, becoming one of the few stocks in the sector to increase, while $TENCENT (00700.HK)$ fell 3.00%, $BABA-W (09988.HK)$ fell 1.21%, $MEITUAN-W (03690.HK)$ fell 0.73%.

However, technical signals show significant divergence: despite the rise in stock price, Baidu's technical indicator summary signal is 'sell', and its RSI reached 62, which is relatively high, indicating short-term technical pressure is mounting. In contrast, the technical signals for Tencent, Meituan, and Alibaba, whose stock prices fell, are all 'buy', suggesting the system has determined they have entered a technical rebound zone. This indicates that Baidu’s strong upward movement occurred amid an overall sector adjustment, but with its own technical indicators issuing a sell warning. This state of 'independent strength but indicator divergence' typically implies limited short-term upward momentum and growing pullback risks.

Baidu Group closed at 125.700 on the previous day (the 27th), with overall commentary focusing on whether it has truly turned strong and whether AI concepts can drive further upside. On one hand, some optimistic voices have emerged, including expectations of challenging higher targets or even long-term potential; on the other hand, some investors believe the upside is limited and the trend remains weak, reflecting growing divergence.
Key points from the commentary highlight three areas of focus:
First, whether AI and chip-related themes are sufficient to support valuation increases;
Second, whether there is still upward momentum after the current price has risen to higher levels;
Third, whether the flow of large-capital funds has begun to dominate short-term trends.
Meanwhile, some investors have already built positions at lower levels and are now starting to focus on profit-taking opportunities.
Market sentiment has shifted from earlier观望 (wait-and-see) to moderately positive, though not yet uniformly optimistic. Some comments reflect expectations for upward momentum, such as 'breakthrough' and 'large-capital entry,' but there are also skeptical voices saying 'slow rise' or 'not strong enough,' which is typical in the early stages of a strengthening trend.
Technically, Baidu's closing price yesterday was 125.700, stabilizing above multiple moving averages and higher than the critical level of 125.042, reflecting an obvious improvement in the short-term structure. However, the closing price on the 27th approached the upper Bollinger Band at 128.445, and the Relative Strength Index (RSI) is above 72, indicating overheating conditions. The reward-to-risk ratio for chasing short-term gains is decreasing, with a higher likelihood of consolidation at elevated levels.
The short-term key lies in whether 125.042 can hold steady. If it holds and breaks through 128.445, there may be upside potential extending to 132.099. If it fails to break above the upper band and falls below 125.042, a retest of support between 122.660 and 120.690 should be watched. Overall, the trend has shifted from weak to strong, but the short term is entering a phase of high-level digestion.
Reply to some investors' views:
@头铁使不得 Doesn't this stock have any semiconductor chip concept? It's only risen a little bit.
The current focus remains on AI-related themes; while the trend has improved, it hasn't entered a rapid ascent phase yet.
@多夠余額不足 Another 100-day one-stop bus ride down
The current price remains above multiple moving averages, showing no signs of weakening structure.
@跨越陰陽行 The trader who successfully bought shares twice during the market decline should be enjoying profits by now.
The current price is already above the critical level, and the upward structure remains intact.
Based on the above analysis, the strategies for deployment can be divided into the following main approaches:
Key deployment: 125.042 is the critical level. Holding above maintains strong consolidation; breaking above 128.445 could test 132.099, while failure could lead to a retest of 122.660 to 120.690.
Strategy One | Consolidate after holding firm at 125.042 for a rebound setup
$UBBAIDU@EC2607B.C (25832.HK)$ | Strike price 160.09 | Actual leverage 7.4x | Approximately 27% out-of-the-money, highly flexible, suitable for capturing the early stage of a rebound after stabilization
$UBBAIDU@EC2610A.C (27686.HK)$ | Strike price 151.21 | Actual leverage 4.8x | Mid-distance out-of-the-money, suitable for continuing the rebound after consolidation
$UBBAIDU@EC2609A.C (28166.HK)$ | Strike price 140 | Actual leverage 4.9x | Near-price range, suitable for stable participation in a rebound with reduced volatility impact
Strategy Two | Follow the trend after breaking through 128.445
$UBBAIDU@EC2607B.C (25832.HK)$ | Strike price 160.09 | Actual leverage 7.4x | High sensitivity to capture the first wave of increase after a breakout
$UBBAIDU@EC2609A.C (28166.HK)$ | Strike price 140 | Actual leverage 4.9x | Stable follow-up after a breakout, suitable for holding until reaching the upper resistance zone
$HSBAIDU@EC2607B.C (24018.HK)$ | Strike price 145.88 | Actual leverage 7.8x | Medium-high leverage configuration, suitable for the acceleration phase post-breakout
Strategy Three | Weakening deployment after losing support at 125.042
$UBBAIDU@EP2607B.P (24276.HK)$ | Strike price 131.7 | Actual leverage 4.1x | Close to current price zone, suitable for capturing the initial drop after losing support
$UBBAIDU@EP2607A.P (20739.HK)$ |Strike Price 113.78|Actual Leverage 5.6x|Medium-distance out-of-the-money, suitable for deploying if the downtrend continues
$HSBAIDU@EP2607A.P (20774.HK)$ |Strike Price 113.78|Actual Leverage 5.8x|Higher leverage, suitable for amplifying declines after confirming a weakening trend
For more market analysis, stay tuned to Jenny's daily updates on 'Hong Kong Stock Warrants'!
Reminder: This article does not constitute any investment advice.
This article is for reference only and does not constitute any investment advice. The market data, opinions, and analysis contained herein may change at any time without prior notice. We are not responsible for any loss or damage caused by reliance on the information in this article. Technical analysis only shows whether certain technical conditions are met; a comprehensive assessment of asset performance should be conducted using additional data. Decisions to trade should not be based solely on this article. Please note that past performance is not indicative of future results.
#HKStocks #Baidu #Real-TimeAnalysis #WarrantSelection #WarrantGuide #DerivativesHedging #HKWarrantsJenny #Blue-ChipStocks #TechnicalAnalysis
Risk Disclaimer: The above content only represents the author's view. It does not represent any position or investment advice of Futu. Futu makes no representation or warranty.Read more

Comments
to post a comment
1