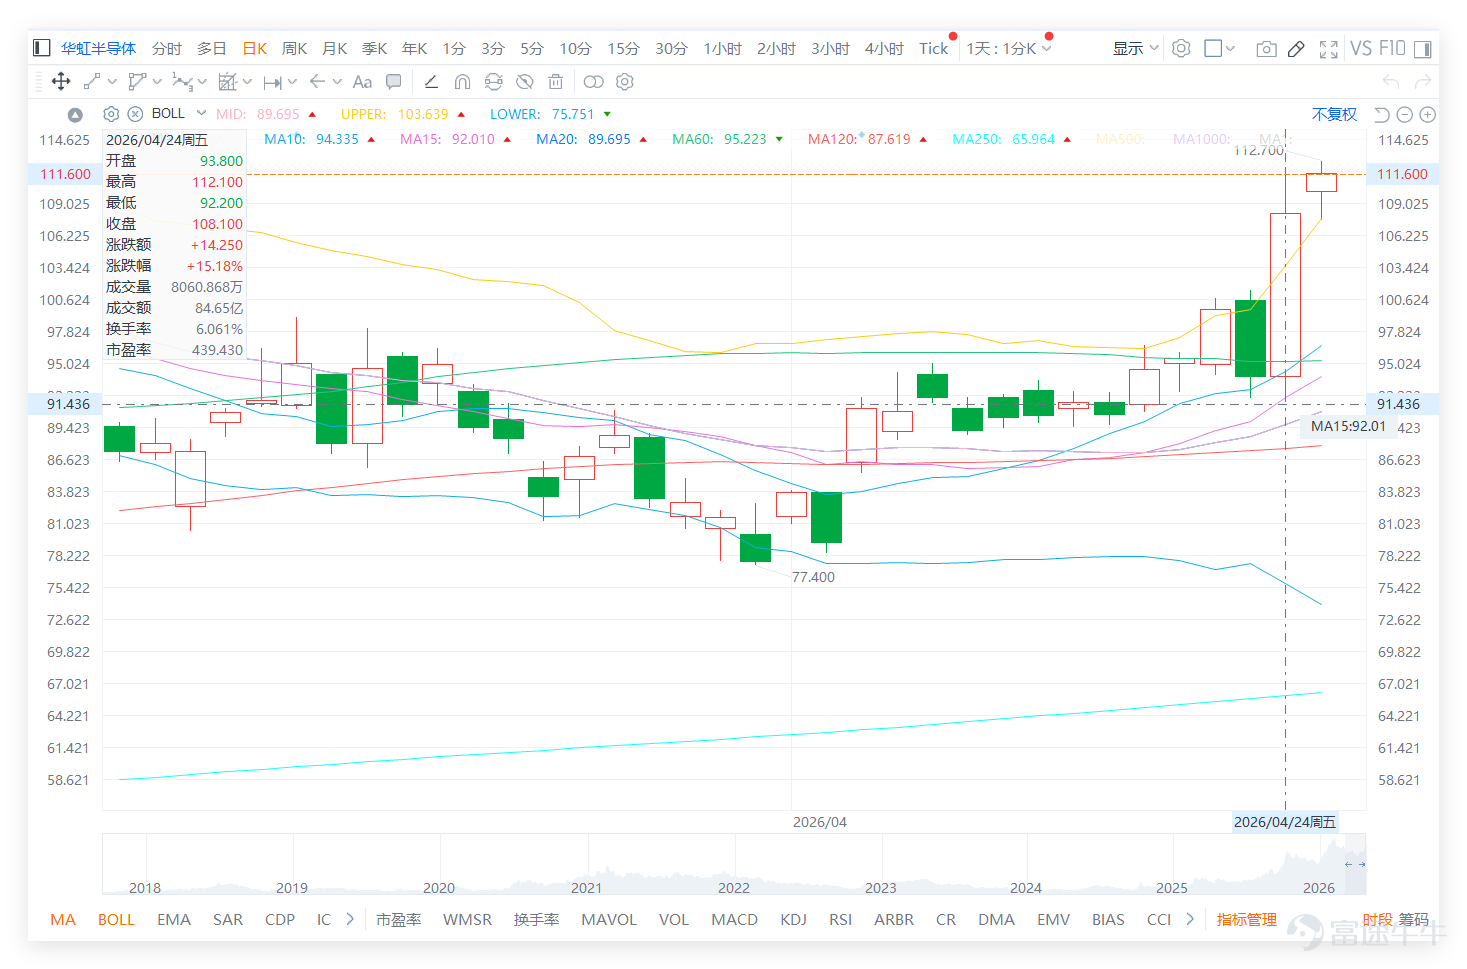

Hua Hong's technical 'sell' signal and price are extremely divergent, sharply increasing the risk of chasing highs.
Last Friday (24th), it closed at 108.100 yuan, with short-term trends clearly strengthening and market sentiment showing clear optimism.
![$HUA HONG GRACE (01347.HK)$ Last Friday (24th), it closed at 108.100 yuan, with short-term trends clearly strengthening and market sentiment showing clear optimism. [Share Link: April 24 [HK Stocks Podcast] Part-1 - Hang Seng Index, Hua Hong Semiconductor, Tencent,] $Hang Seng Index (800000.HK)$$TENCENT (00700.HK)$ According to last Friday’s technical analysis data, Hua Hong Semiconductor's stock price of 108.100 is higher than its short-term moving average MA10 (94.34 yuan) and medium-term moving average MA30 (89.91 yuan), but lower than the long-term moving average MA60 (95.22 yuan). Its overall technical indicator signal is 'sell'. In the semiconductor sector, $SMIC (00981.HK)$ Closed at 64.3 yuan, surging 10.01%, with the overall technical indicator signal being 'sell'. $SHANGHAI FUDAN (01385.HK)$ Closed at 43.56 yuan, dropping 2.07%, with the overall technical indicator signal also being 'sell'. $ASMPT (00522.HK)$ Closed at 165.2 yuan, rising 6.93%, with the overall technical indicator signal being 'strong sell'. Hua Hong Semiconductor had the highest single-day gain in the sector. Overall, last Friday (24th), the semiconductor sector experienced a strong rebound, especially notable for Hua Hong and SMIC, but their overall technical indicators consistently issued bearish warnings, indicating that after the sharp rise in stock prices, technical...](https://nnqimage.futunn.com/sns_client_feed/1162342/20260427/web-1777256492981-MIyOrBANpV.png/big?area=1&is_public=true&imageMogr2/ignore-error/1/format/webp)
According to last Friday's technical analysis data, Huahong Semiconductor's stock price at 108.100 is higher than its short-term moving average MA10 (94.34 yuan) and medium-term moving average MA30 (89.91 yuan), but lower than the long-term moving average MA60 (95.22 yuan). Its technical indicator summary signal is 'Sell'.
![$HUA HONG GRACE (01347.HK)$ Last Friday (24th), it closed at 108.100 yuan, with short-term trends clearly strengthening and market sentiment showing clear optimism. [Share Link: April 24 [HK Stocks Podcast] Part-1 - Hang Seng Index, Hua Hong Semiconductor, Tencent,] $Hang Seng Index (800000.HK)$$TENCENT (00700.HK)$ According to last Friday’s technical analysis data, Hua Hong Semiconductor's stock price of 108.100 is higher than its short-term moving average MA10 (94.34 yuan) and medium-term moving average MA30 (89.91 yuan), but lower than the long-term moving average MA60 (95.22 yuan). Its overall technical indicator signal is 'sell'. In the semiconductor sector, $SMIC (00981.HK)$ Closed at 64.3 yuan, surging 10.01%, with the overall technical indicator signal being 'sell'. $SHANGHAI FUDAN (01385.HK)$ Closed at 43.56 yuan, dropping 2.07%, with the overall technical indicator signal also being 'sell'. $ASMPT (00522.HK)$ Closed at 165.2 yuan, rising 6.93%, with the overall technical indicator signal being 'strong sell'. Hua Hong Semiconductor had the highest single-day gain in the sector. Overall, last Friday (24th), the semiconductor sector experienced a strong rebound, especially notable for Hua Hong and SMIC, but their overall technical indicators consistently issued bearish warnings, indicating that after the sharp rise in stock prices, technical...](https://nnqimage.futunn.com/sns_client_feed/1162342/20260427/web-1777256502749-ywvNRnuQLy.png/big?area=1&is_public=true&imageMogr2/ignore-error/1/format/webp)
In the semiconductor sector, $SMIC (00981.HK)$ closed at 64.3 yuan, surging 10.01%, with the technical indicator summary signal being 'Sell'. $SHANGHAI FUDAN (01385.HK)$ closed at 43.56 yuan, falling 2.07%, with the technical indicator summary signal also being 'Sell'. $ASMPT (00522.HK)$ closed at 165.2 yuan, rising 6.93%, with the technical indicator summary signal being 'Strong Sell'. Huahong Semiconductor had the highest daily gain in the sector.
Overall, last Friday (May 24th), the semiconductor sector saw a strong rebound, with particularly significant gains for Huahong and SMIC. However, the technical indicator summary signals unanimously issued bearish warnings, indicating that after the sharp rise in stock prices, technical models generally believe that short-term risks have quickly accumulated. Investors need to be wary of profit-taking pressures.
Many investors in the comments believe that the previous pullback was just a shakeout, with funds washing out retail investors before pushing prices up again. There are also voices anticipating the stock price testing levels of 120 yuan, 124 yuan, 130 yuan, or even higher, reflecting an increasing momentum-chasing sentiment.
However, disagreements are starting to emerge at this stage. On one hand, investors believe that the large bullish candle represents strength, and after stabilizing between 102 yuan and 105 yuan, there is still room for further gains. On the other hand, some worry about the rapid rise over a short period, high valuations, quick rises followed by quick falls, and the risk of distribution at high levels. Overall sentiment is positive, but it is no longer a low-risk entry point.
Common questions focus on three aspects:
First, whether the current price still has upside potential;
Second, whether the 110 yuan to 112 yuan range can be broken through;
Third, whether there will be a pullback after a sharp rise.
Technically, Huahong's current price is above several key moving averages and has broken through the upper Bollinger Band at 103.639 yuan, indicating clear short-term strength. However, the Relative Strength Index (RSI) has risen to 75.955, which is already at an overheated level, and the current price is also close to the resistance level of 112.100 yuan; the risk-reward ratio for chasing the stock is not high.
The short-term key level is 103.639 yuan.If the price can stabilize above this level and further break through 112.100 yuan, the stock may continue its strong momentum and push towards 120 yuan.However, if it falls back below 103.639 yuan, it will need to watch for a retest of 98.300 yuan, and the trend might enter a consolidation phase at higher levels. For now, it should be viewed as a strong stock experiencing fluctuations at high levels, and the risk of a pullback after a rapid rise should not be ignored.
Reply to some investors' views:
@過山 If it can hold on to the highs against the market trend, it indicates solid buying support, but the situation is already overheated. It remains to be seen whether 103.639 yuan can hold firm.
@新手求庇護 After exiting at 94.2 yuan, the stock price surged quickly, and the current price is already near the resistance zone; it is not advisable to chase the price out of regret.
@何弃疗26 Last week’s movement could be viewed as a rebound after a shakeout, but it still needs to confirm whether 112.100 yuan can be broken through.
Based on the above analysis, the strategies for deployment can be divided into the following main approaches:
Key Deployment: If the price stabilizes above 103.639 yuan, look for the continuation of upward momentum; breaking through 112.100 yuan could lead to testing 120.000 yuan; if it falls back below 103.639 yuan, in the short term, watch for a retest of 98.300 yuan.
Strategy 1: Deploy along with the trend once stabilized above 103.639 yuan.
$CIHUAHO@EC2610A.C (20859.HK)$ | Strike price 108.88 yuan | Actual leverage 3.0x | Close to current price, suitable for following up at a closer price if stability holds after a sharp rise
$BIHUAHO@EC2610A.C (20918.HK)$ | Strike price 109.00 yuan | Actual leverage 3.1x | Strike price close to the immediate breakout zone, suitable for capturing short-term upward momentum
$UBHUAHO@EC2608A.C (24990.HK)$ | Strike price 140.09 yuan | Actual leverage 4.1x | Higher strike price offers greater flexibility, suitable for chasing momentum with small bets if strength remains intact
Strategy Two | Break above 112.100 yuan to chase bullish momentum
$BIHUAHO@EC2607C.C (24321.HK)$ | Strike price 127.00 yuan | Actual leverage 4.5x | Strike price above short-term resistance, suitable for pursuing extended gains after confirming a breakout
$CIHUAHO@EC2606B.C (27139.HK)$ | Strike price 128.88 yuan | Actual leverage 5.5x | Higher leverage, suitable for use when momentum accelerates post-breakout
$UBHUAHO@EC2608A.C (24990.HK)$ | Strike price 140.09 yuan | Actual leverage 4.1x | Further distance, suitable for expecting continued upward movement without deploying too close to the money
For more market analysis, stay tuned to Jenny's daily updates on 'Hong Kong Stock Warrants'!
Reminder: This article does not constitute any investment advice.
This article is for reference only and does not constitute any investment advice. The market data, opinions, and analysis contained herein may change at any time without prior notice. We are not responsible for any loss or damage caused by reliance on the information in this article. Technical analysis only shows whether certain technical conditions are met; a comprehensive assessment of asset performance should be conducted using additional data. Decisions to trade should not be based solely on this article. Please note that past performance is not indicative of future results.
#HKStocks #HuaHong #SemiconductorSector #Real-TimeAnalysis #WarrantPick #WarrantGuide #DerivativesHedging #HKWarrantsJenny #Blue-ChipStocks #TechnicalAnalysis
Risk Disclaimer: The above content only represents the author's view. It does not represent any position or investment advice of Futu. Futu makes no representation or warranty.Read more

Comment (1)
to post a comment
2