CATL (3750) Short-term Analysis: Stock price has pulled back from its peak to consolidate below RMB 700, with a 5-day volatility of 9.5% expanding.
CATL's stock is trading at RMB 688.5. The share price has retreated from its previous high to consolidate below RMB 700, with a 5-day volatility reaching 9.5%, showing a significant expansion in the range. The short-term trend shows characteristics of a pullback after peaking followed by consolidation. DBS Bank recently raised CATL's target price from RMB 675 to RMB 925, maintaining a 'Buy' rating. Additionally, CICC previously increased CATL's H-share target price by 12.1% to RMB 650, maintaining an 'Outperform Industry' rating.
Technical Structure Analysis
Technically, the main support levels for the current stock price are set at RMB 653 and RMB 608, while resistance levels are at RMB 732 and RMB 761, with a 52% probability of upward movement. The Relative Strength Index (RSI) stands at 62, indicating that short-term momentum remains strong but has declined from earlier highs, suggesting that the stock price is in a normal adjustment phase after a strong run. In terms of moving averages, the 10-day line is at RMB 692.9, the 30-day line at RMB 657.47, and the 60-day line at RMB 579.73; the current price of RMB 684.5 has fallen below the 10-day line but remains significantly above the 30-day and 60-day lines, reflecting some easing of short-term trends but the medium-term upward structure remains intact.
In terms of Bollinger Bands, the current price is close to the middle band, with some distance to the upper band, indicating an opportunity to rebuild upward momentum after the pullback. A summary of comprehensive technical indicators signals 'Buy', with multiple oscillators also showing buy signals. The bull-bear power indicator suggests possible bottom-building due to oversold conditions, though MACD indicates a sell signal, showing temporary divergence between buying and selling forces.
Overall, CATL's current price is 688.5 yuan, still within the consolidation range between 653 yuan and 732 yuan. If the stock price can hold steady above the 653 yuan support level, the intermediate upward structure will remain intact, and there will still be opportunities to challenge the resistance levels at 732 yuan and 761 yuan. A breakout above the 732 yuan resistance due to positive news could lead to another test of the 761 yuan high. Conversely, if the 653 yuan support fails, it will be necessary to watch for a deeper support zone near 608 yuan.
Market Commentary Reply:
@Xiaomi Shang Pian KeThe current price remains above the key medium- and short-term moving averages, and overall, it hasn't weakened yet. However, to truly move higher, it must first break through 708.000 yuan.
@True Beginner ZZTechnically, to move higher, it needs to first stabilize above 699.000 yuan before attempting to break through 708.000 yuan.
Warrant product recommendations
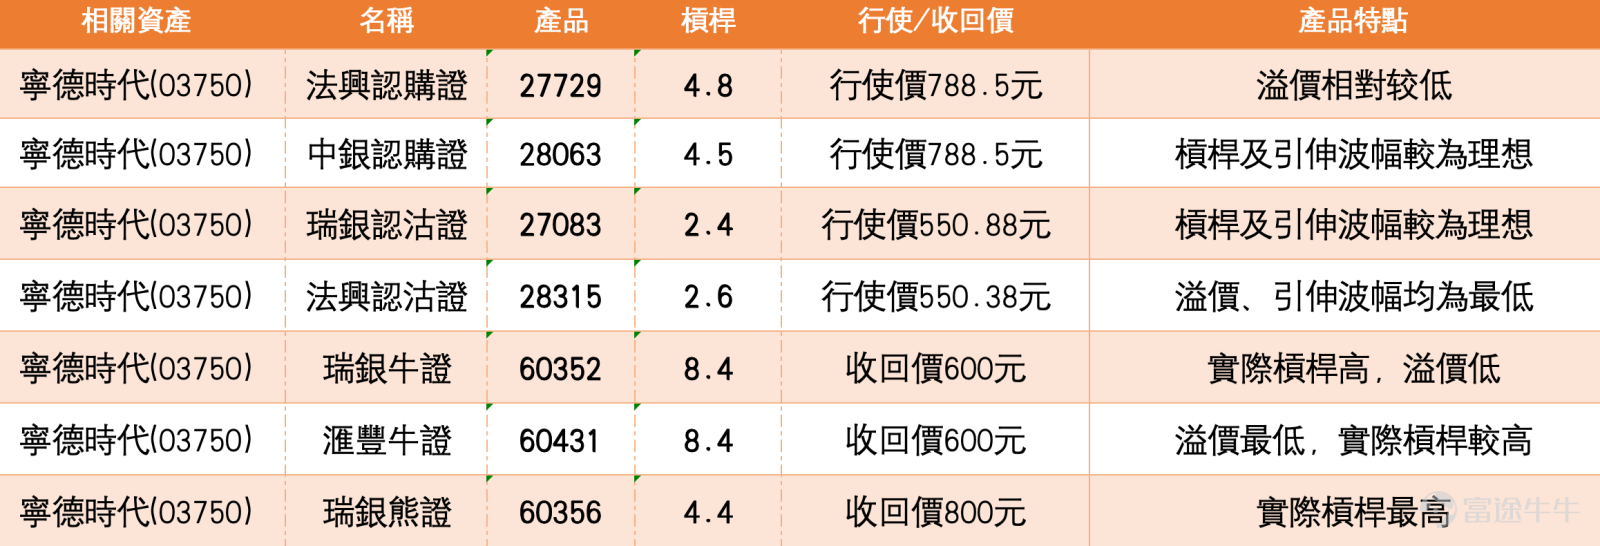
If you are optimistic about the direction and expect the stock price to hold steady at 653 yuan with a gradual rebound, you may consider Societe Generale call warrants (27729).$SG-CATL@EC2612B.C (27729.HK)$The exercise price is 788.5 yuan, offering leverage of 4.8 times with relatively low premium, making it suitable for deployment once support holds. Bank of China call warrants (28063)$BI-CATL@EC2612C.C (28063.HK)$with an exercise price of 788.5 yuan, leverage of 4.5 times, and more controlled implied volatility, providing steadier tracking of the underlying stock’s movements. Both have exercise prices above the 732 yuan resistance level, meaning they will only gradually move in-the-money after the stock price breaks through that resistance.
If the stock price is expected to encounter resistance around 732 yuan and pull back, a bearish strategy might be considered. UBS Group put warrants (27083), with an exercise price of 550.88 yuan, leverage of 2.4 times, and ideal implied volatility, making them suitable for following up after breaking below the 608 yuan support. Societe Generale put warrants (28315)$SG-CATL@EP2703A.P (28315.HK)$with an exercise price of 550.38 yuan, leverage of 2.6 times, and the lowest premium and implied volatility, offering more direct tracking of the underlying stock's decline.
For bull and bear certificates, those who are optimistic can choose the UBS bull certificate (60352) $UB#CATL RC2609F.C (60352.HK)$ , with a recovery price of 600 yuan, leverage of 8.4 times, low premium, and high sensitivity to upward momentum; HSBC bull certificate (60431), with a recovery price of 600 yuan, leverage of 8.4 times, the lowest premium in its category, and high efficiency in following upward movements. Both have recovery prices below the 608-yuan support level, providing a safety buffer. For those who are pessimistic, the UBS bear certificate (60356) can be selected, with a recovery price of 800 yuan, leverage of 4.4 times, offering the highest actual leverage among similar bear certificates, making it suitable for capturing pullbacks after resistance at higher levels.

Warm Reminder: This article does not constitute any investment advice. It is for reference only and does not constitute any investment advice. The market data, opinions, and analysis contained herein may change at any time without prior notice. We are not responsible for any loss or damage caused by reliance on the information in this article. Technical analysis only shows whether certain technical conditions are met; a comprehensive evaluation of asset performance should be made using other data, and trading decisions should not be based solely on this article. Please note that past performance is not indicative of future results. Follow HK Stocks Warrants Jenny for more professional insights.
Risk Disclaimer: The above content only represents the author's view. It does not represent any position or investment advice of Futu. Futu makes no representation or warranty.Read more

Comment (1)
to post a comment
3