
SMIC (00981): RSI rebounds to 50, momentum shifts from weak to neutral preference
SMIC's stock price rose significantly, closing at HKD 63.35, with an increase of 8.38%. The trading volume reached HKD 9.339 billion, reflecting a noticeable improvement in market capital inflow. After rebounding from the low of HKD 49.320, the stock price has steadily increased and is now above the 5-day, 10-day, and 20-day moving averages, showing a more stable short-term structure. The overall trend has gradually shifted from a weak position to stronger consolidation.
In terms of technical structure, the main support levels for the current stock price are set at HKD 56.7 and HKD 54.5, while resistance levels are at HKD 67.4 and HKD 71.3, with a 47% probability of an upward movement. The Relative Strength Index (RSI) has rebounded to the 50 level, indicating that short-term momentum has shifted from earlier weakness to a neutral preference. In terms of moving averages, the stock price is clearly stabilized above the 5-day line (HKD 59.44) and the 10-day line (HKD 57.80), showing that the short-term trend has been technically restored. Regarding the Bollinger Bands, the current price has gradually approached the upper band, indicating that the uptrend continues but the upward space is beginning to narrow. The comprehensive technical indicator summary signal is "Buy"; multiple oscillation indicators also show buy signals, including the Stochastic Oscillator and the CCI indicator both issuing buy signals. The MACD signal also shows a buy, but the RSI and ADX indicators remain neutral, while the VR trading ratio indicator shows a sell signal. Overall, SMIC has entered a relatively strong region after a rebound in the short term, but it is still necessary to be mindful of overhead resistance.
Overall, SMIC's current price at HKD 63.3 has already broken through the psychological threshold of HKD 60, showing a relatively strong short-term trend. The first resistance level is set at HKD 67.4. If the stock price can stabilize above HKD 66 and further break through HKD 67.4, there is a short-term opportunity to test HKD 71.3. If the stock price repeatedly faces pressure near HKD 67.4 and falls back below HKD 60, it is necessary to watch for a retest of support near HKD 56.7. At this stage, the trend has gradually evolved from a rebound at the low point to stronger consolidation, maintaining a neutral to favorable risk-reward ratio. However, due to the significant accumulated gains in the stock price, it would be more suitable to wait for a pullback confirmation or continue following up after a breakout.
Warrant Product Review
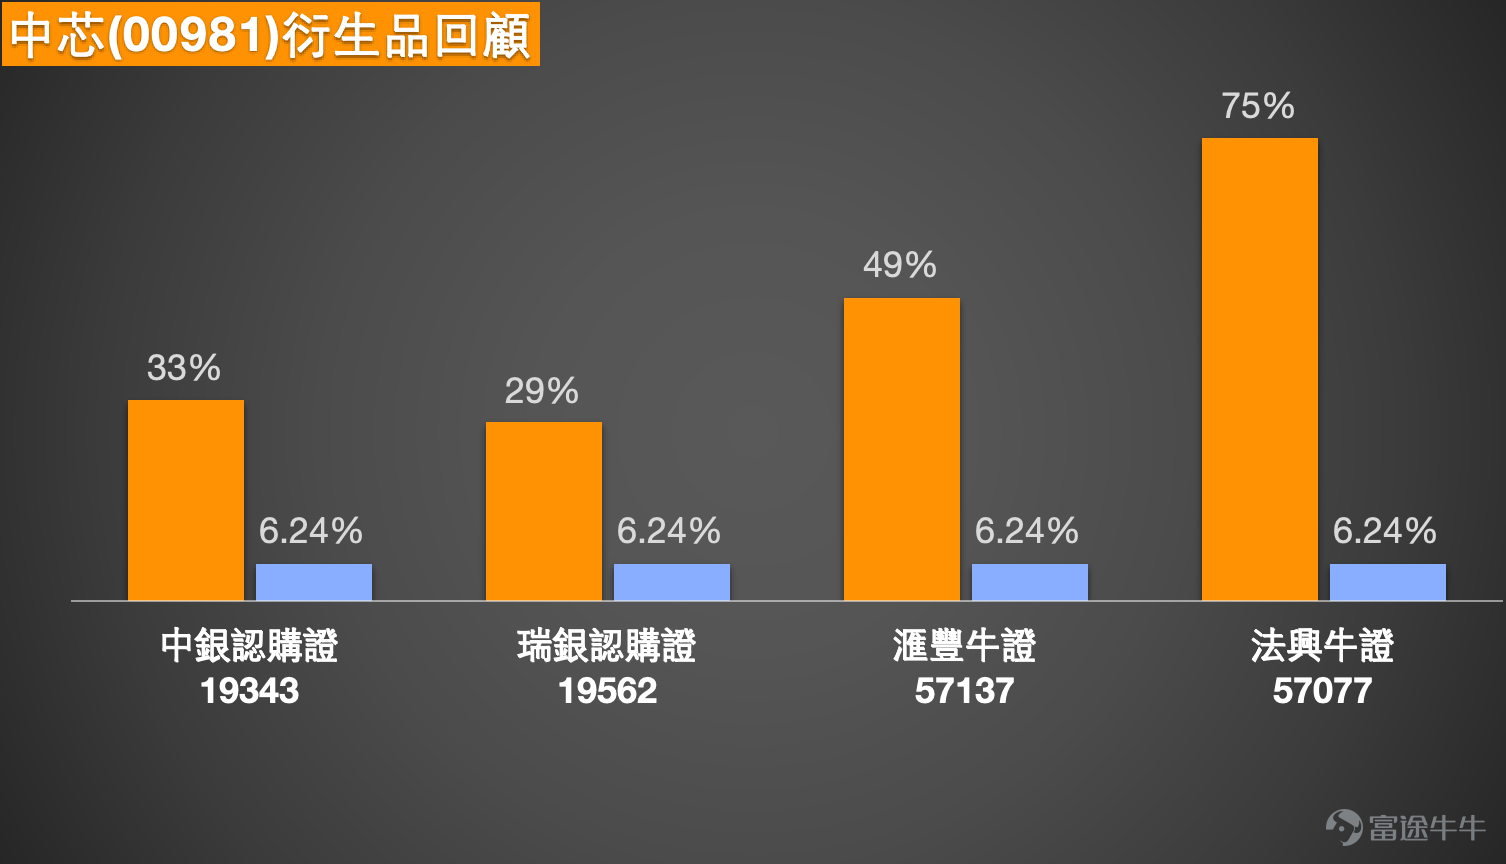
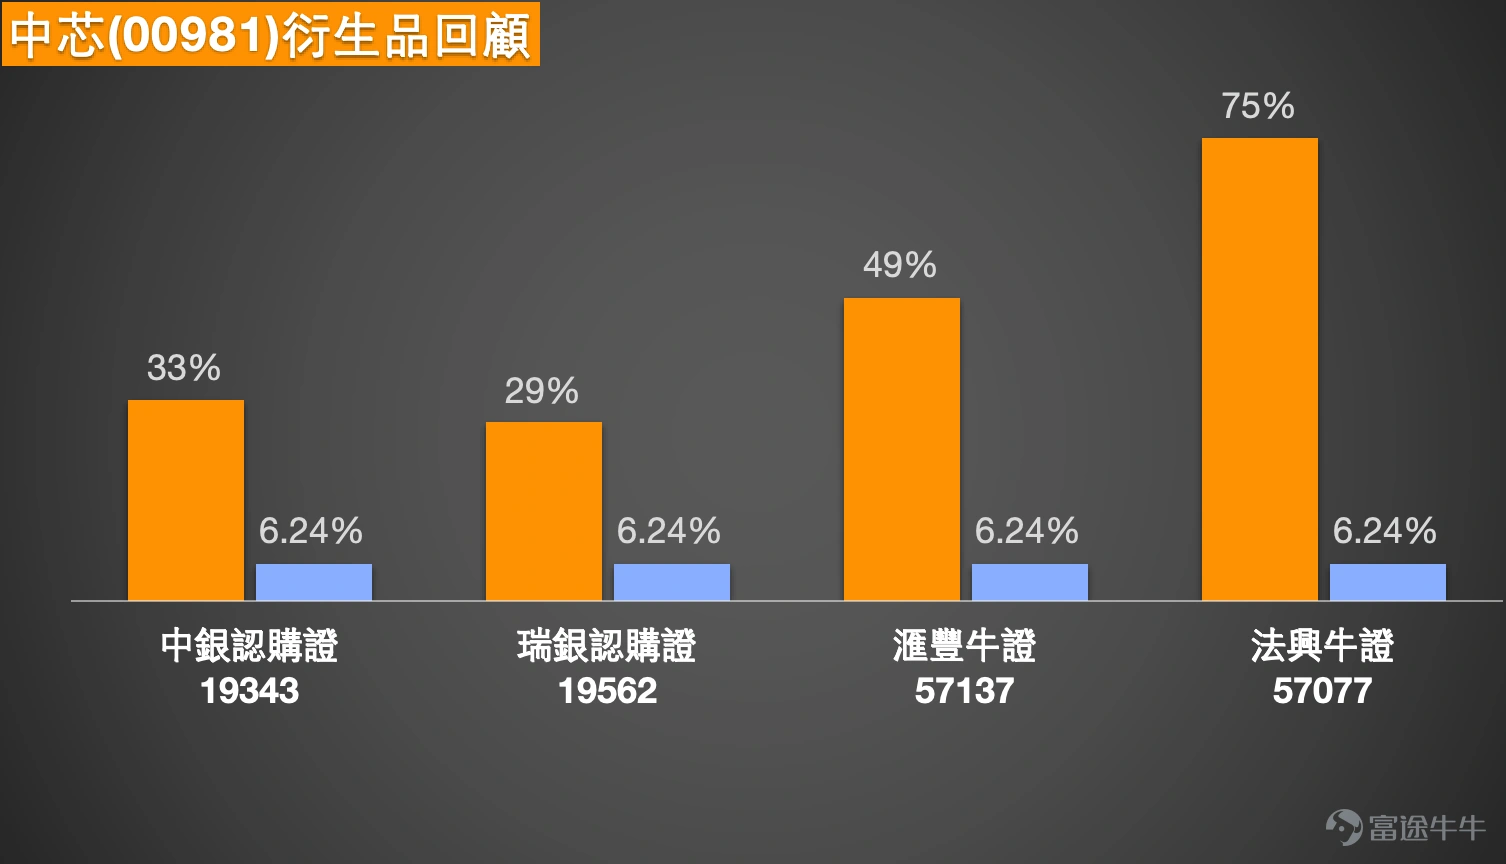
Reviewing the warrant products mentioned on April 22, the following is their performance within two trading days after the mentioned date. Societe Generale Bull Certificate (57077) $SG#SMIC RC2611C.C (57077.HK)$ Recorded a 75% increase, while the underlying stock rose by 6.24% during the same period, clearly outperforming the underlying stock. HSBC Bull Certificate (57137) $HS#SMIC RC2611C.C (57137.HK)$ Recorded a 49% increase, significantly outperforming the underlying stock. UBS Group call warrant (19562) gained 29%, surpassing the performance of the underlying stock during the same period. BOC call warrant (19343). $BI-SMIC@EC2609B.C (19343.HK)$ Recorded a 33% gain, also outperforming the underlying stock.
Warrant product recommendations
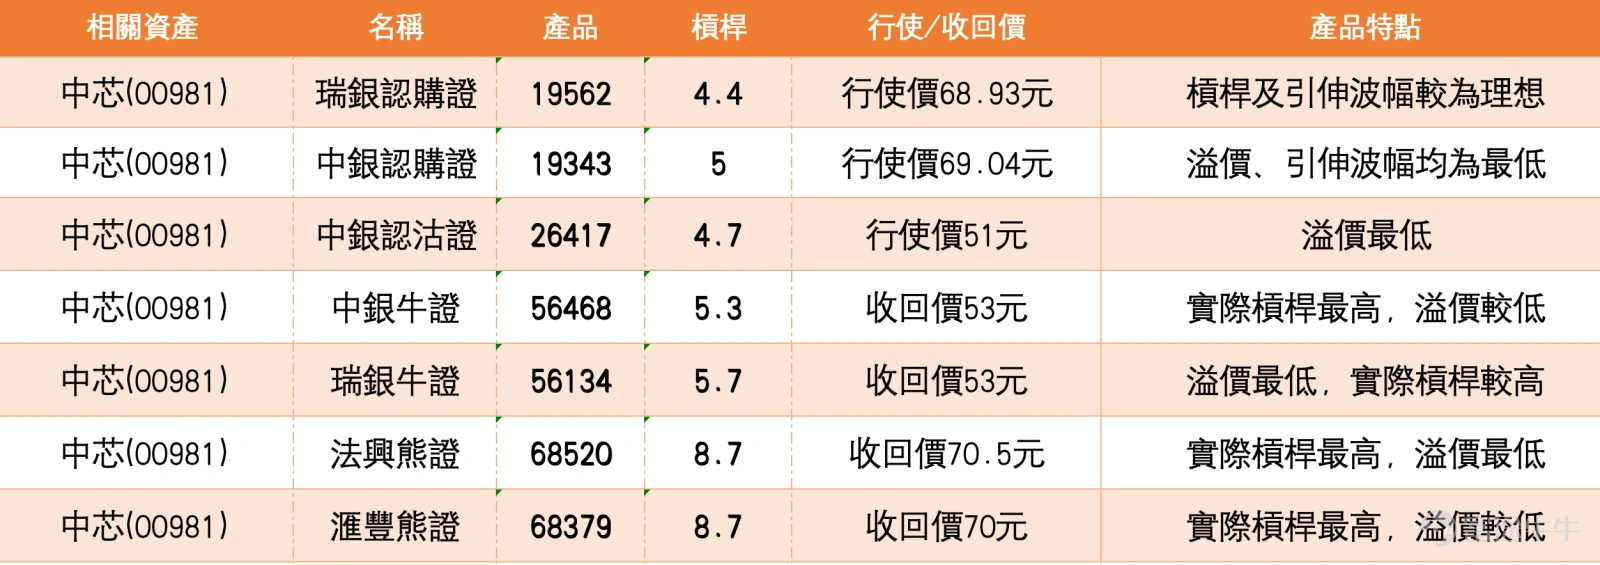
The following products are analyzed based on today's SMIC share price of 63.1 yuan. For those optimistic about the continuation of the rebound, the UBS Group call warrant (19562), with an exercise price of 68.93 yuan and leverage of 4.4 times, has relatively ideal leverage and implied volatility, suitable for following when the share price breaks through the resistance level at 67.4 yuan. The BOC call warrant (19343), with an exercise price of 69.04 yuan and leverage of 5.0 times, has the lowest premium and implied volatility, making it more sensitive to changes in the underlying stock and suitable for short-term trend chasing. If you expect resistance at higher levels, the BOC put warrant (26417), with an exercise price of 51 yuan and leverage of 4.7 times, has the lowest premium and is suitable for deploying bearish positions when the share price tests support at 56.7 yuan.
For bull-bear certificates, optimists may choose the UBS Group bull certificate (56134), with a stop-loss price of 53 yuan and leverage of 5.7 times, having the lowest premium among similar products, allowing for more controllable holding costs; the BOC bull certificate (56468), with a stop-loss price of 53 yuan and leverage of 5.3 times, has the highest actual leverage and higher sensitivity to upward movements. Pessimists can choose the Societe Generale bear certificate (68520), with a stop-loss price of 70.5 yuan and leverage of 8.7 times, having the highest actual leverage and lowest premium; HSBC bear certificate (68379), with a stop-loss price of 70 yuan and leverage of 8.7 times, also belongs to high leverage and is suitable for following pullbacks when resistance is encountered.
Warm Reminder: This article does not constitute any investment advice. It is for reference only and does not constitute any investment advice. The market data, opinions, and analysis contained herein may change at any time without prior notice. We are not responsible for any loss or damage caused by reliance on the information in this article. Technical analysis only shows whether certain technical conditions are met; a comprehensive evaluation of asset performance should be made using other data, and trading decisions should not be based solely on this article. Please note that past performance is not indicative of future results. Follow HK Stocks Warrants Jenny for more professional insights.
Risk Disclaimer: The above content only represents the author's view. It does not represent any position or investment advice of Futu. Futu makes no representation or warranty.Read more
Comment (1)
to post a comment
1