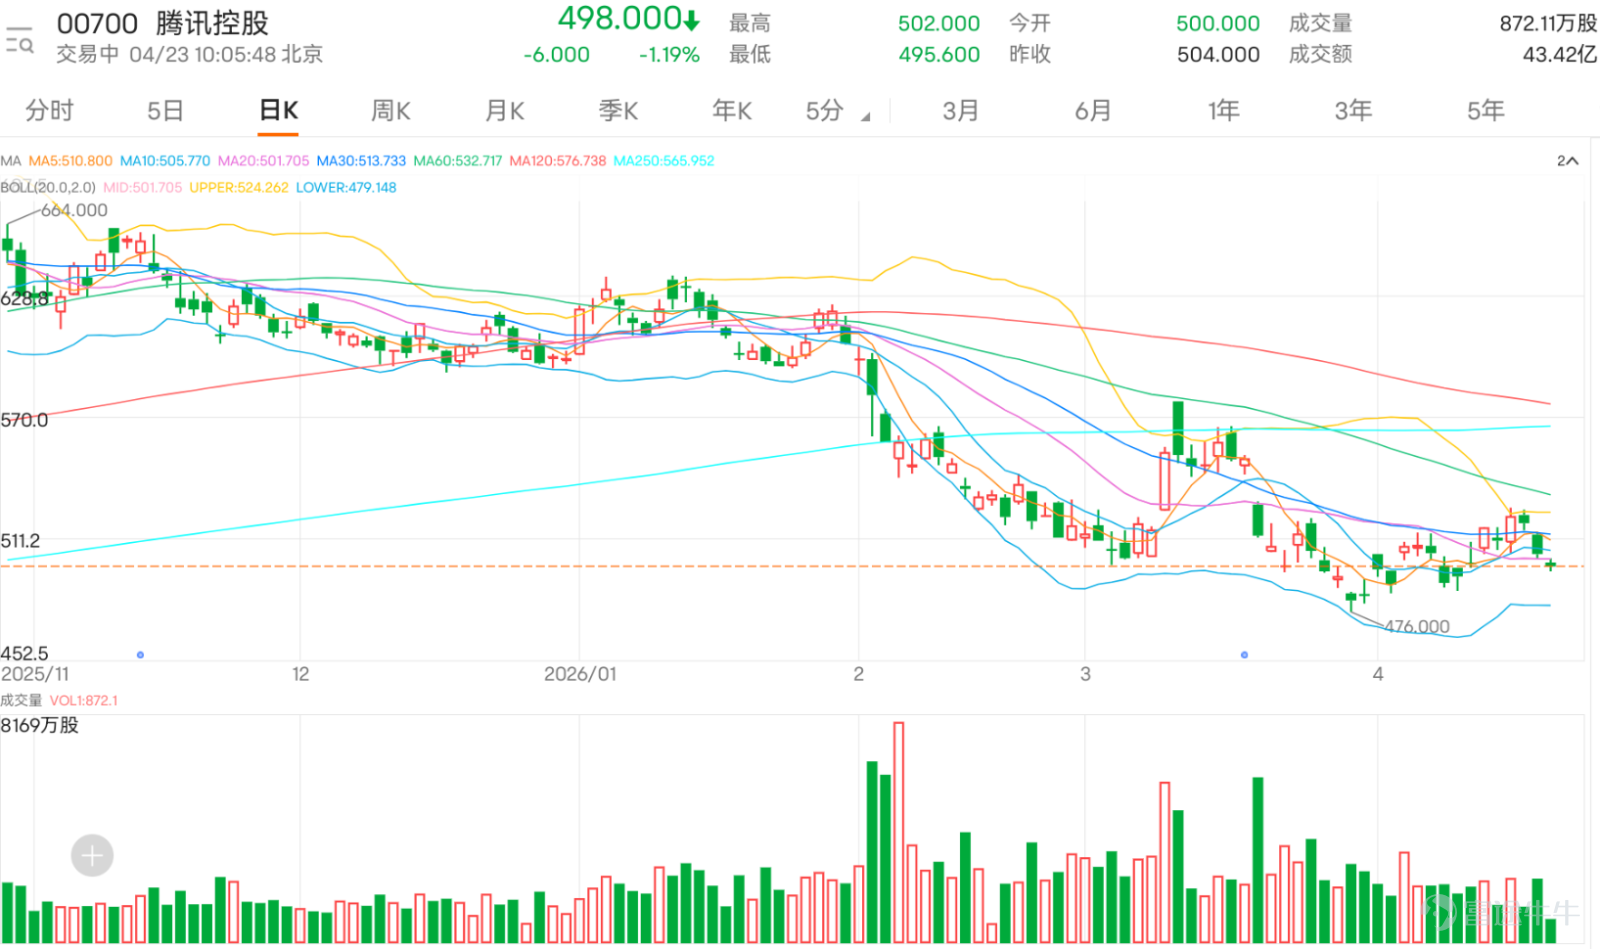
Tencent fell below the 500-yuan mark, with weak market sentiment awaiting a true strengthening signal.
$TENCENT (00700.HK)$ Tencent dropped over 1%, hitting an intraday low of 495.4 yuan, breaking below multiple moving averages. Judging from the commentary atmosphere, market sentiment remains conservative and even somewhat disappointed. Some investors still have confidence in the company’s long-term fundamentals, believing its profit model is stable, and are optimistic that AI and related directions could drive a revaluation in the coming months; however, on a short-term basis, more voices are focusing on the weak stock price, lackluster rebounds, and sharp declines, with some worrying about further drops tomorrow, reflecting insufficient market confidence in near-term performance. Such sentiment typically indicates the stock price is still in the early stages of recovery and has yet to rebuild strong consensus.
Common questions mainly focus on three areas: First, whether Tencent has bottomed out and can hold above the 500-yuan level; second, whether it is currently suitable to re-enter the market; third, whether the weakness in the stock price is related to AI progress and market expectations. From a technical perspective, the area around 500 yuan has indeed become a short-term psychological and technical threshold, but whether it can truly stabilize depends on whether it can hold above 501.725 and subsequently break through the resistance at 514.500.
In terms of technical consolidation, the Relative Strength Index (RSI) stands at 45.716, indicating that short-term momentum remains average without clear signs of strengthening. The current price has fallen below the Bollinger Bands' middle axis, which means Tencent has transitioned from the previous range-bound trading to a weaker trading zone. If it can stabilize above 501.725, the short-term weakness may ease; if it breaks above 514.500, there will be an opportunity to test 523.621 in the short term; conversely, if it fails to hold above 501.725, attention should be paid to whether there is sufficient support at 492.292 or lower support levels.
From a technical perspective, Tencent's share price has now fallen below the 5-day, 10-day, and 20-day moving averages, clearly signaling short-term bearishness. The middle axis of the Bollinger Bands (20-day line) is at 501.6 yuan, and the current price has fallen below this axis, meaning the previous rebound zone has officially shifted to a weaker trading phase.
The key short-term inflection point is at 501.6 yuan: if it can quickly recover and stabilize above this level, the short-term weakness may ease; if it further breaks above 514.500 yuan, there will be an opportunity to test the upper channel boundary at 524.2 yuan. Conversely, if the price continues to trade below 501.6 yuan, attention should first be paid to testing the lower channel boundary at 479 yuan for support; if support there is insufficient, a retest of the previous low at 476 Hong Kong dollars is possible, potentially opening up further medium-term downside space.

Key deployment: 501.725 is the short-term watershed. If it holds steady, continue observing the rebound and consolidation. If it breaks through 514.500, there's a short-term opportunity to test 523.621; if it fails to hold 501.725, watch for a retest of 492.292, further looking at support near 479.181.
Strategy One | Deployment on pullback after holding above 501.725
$UBTENCT@EC2606A.C (14490.HK)$ | Strike Price 500.5 | Actual Leverage 10.3x | Close to price with high elasticity, suitable for quick follow-up rebounds after stabilizing near the watershed, focusing on capturing a rise from the support level.
$HSTENCT@EC2607A.C (14148.HK)$ | Strike Price 500 | Actual Leverage 10.4x | Direct response to underlying stock movement, suitable for phased accumulation on pullbacks, betting on the stock price to stabilize above the midpoint again.
$UBTENCT@EC2706A.C (27993.HK)$ | Strike Price 500.5 | Actual Leverage 4.0x | Milder leverage, more suitable for less aggressive positions, allowing more time for the rebound to extend.
Strategy Two | Breakthrough above 514.500 momentum chase deployment
$UBTENCT@EC2609D.C (27928.HK)$ | Strike Price 600.4 | Actual Leverage 8.6x | Suitable for chasing momentum after a breakout, balancing elasticity and position space, good for betting on the stock transitioning from rebound to further upward push.
$BPTENCT@EC2609D.C (28011.HK)$ | Strike Price 580.5 | Actual Leverage 9.3x | A more aggressive momentum tool; if acceleration occurs after the breakout, return elasticity will be more noticeable.
$BITENCT@EC2609E.C (28036.HK)$ | Strike Price 580.5 | Actual Leverage 9.4x | Close to an offensive scenario, suitable as the main position post-breakout, focusing on pushing towards 523.621 after breaking above 514.500.
Strategy Three | Deployment turning bearish upon failure to hold 501.725
$UBTENCT@EP2606A.P (21984.HK)$ | Strike Price 499.8 | Actual Leverage 9.2x | Close to the breakdown point, suitable for shorting immediately after falling below the watershed to capture a downward move towards 492.292.
$BPTENCT@EP2606A.P (21974.HK)$ | Strike Price 500 | Actual Leverage 9.5x | Higher leverage, suitable for those seeking to amplify short-term declines after a breakdown; a more aggressive shorting tool.
$CTTENCT@EP2606A.P (22045.HK)$ | Strike Price 499.8 | Actual Leverage 9.4x | Positioned between the two, suitable as a balanced shorting tool that can follow through on a breakdown or watch for a continued drop towards lower support areas.
Reply to some investors' views:
@半弦Long-term fundamentals still offer support, but the stock price has not yet broken out of its consolidation pattern in the short term.
@AhuyfcIf it breaks below 501.725, the likelihood of testing 492.292 in the short term will increase.
@摇摆的小韭菜The AI direction remains promising, but the stock price needs to break through resistance levels to reflect this more clearly.
@秦臻The recent weakness indicates that selling pressure from above has not been fully absorbed.
@Safe harborThe focus remains on the buying support around the 500 level and the performance of the resistance zone between 514 and 524.
Feel free to share your insights in the comment section. For more market analysis, please continue following ‘Hong Kong Stock Warrants Jenny’ for daily updates!
Reminder: This article does not constitute any investment advice.
This article is for reference only and does not constitute any investment advice. The market data, opinions, and analysis contained herein may change at any time without prior notice. We are not responsible for any loss or damage caused by reliance on the information in this article. Technical analysis only shows whether certain technical conditions are met; a comprehensive assessment of asset performance should be conducted using additional data. Decisions to trade should not be based solely on this article. Please note that past performance is not indicative of future results.
#HKStocks #Real-TimeAnalysis #WarrantPick #WarrantGuide #DerivativesHedging #HKWarrantsJenny #TencentHoldings #00700 #Blue-ChipStocks #TechnicalAnalysis$Hang Seng Index (800000.HK)$$Hang Seng TECH Index (800700.HK)$
Risk Disclaimer: The above content only represents the author's view. It does not represent any position or investment advice of Futu. Futu makes no representation or warranty.Read more

Comments (3)
to post a comment
1