Lenovo's upward momentum faces a technical bottleneck, with RSI at 69 indicating pullback pressure; short-term strength hinges on the HKD 11.25 level.
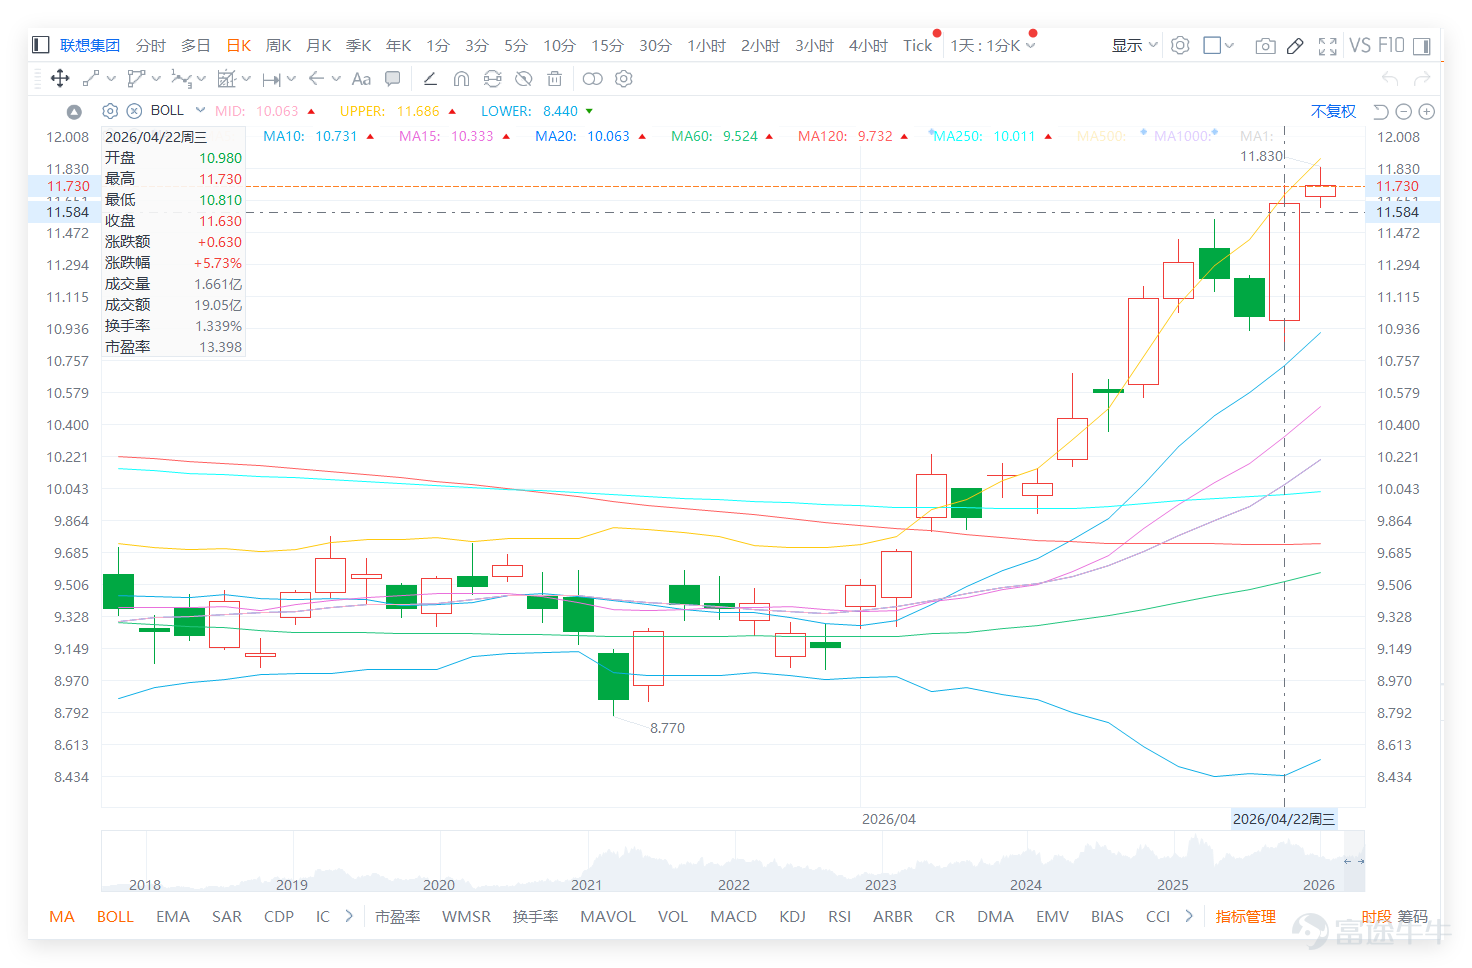
Following a rebound from the low of HKD 8.770, there has been an acceleration in the recent uptrend, with the share price consistently holding above multiple short-term moving averages, signaling a clear strengthening in the short-term trend.
However, the closing price on the previous day (22nd) had risen to 11.630, approaching the short-term high of 11.730, while also nearing the upper Bollinger Band at 11.686, indicating that the uptrend has entered an overheated zone and the potential for further upward movement in the short term is beginning to narrow.

From the technology hardware and PC sector perspective, the market trend was mixed on the previous day (22nd), with Lenovo Group surging 5.73% to lead the gains. $AAC TECH (02018.HK)$ Slightly up by 1.20%, while $SMIC (00981.HK)$ fell by 1.33%.
However, the technical risks are highly aligned: despite Lenovo's strong stock performance, its RSI is as high as 69 (extremely overbought), with a technical rating of 'Sell' accompanied by a 'Strong Sell' signal, showing that the short-term rise has significantly overextended, leading to a clear divergence between technical indicators and price. Notably, AAC Technologies is also in an overbought state (RSI 65) and received a 'Sell' signal. This indicates that Lenovo's strong upward push occurred in an environment where the overall sector's technical picture was already weak or overbought, and its rapid rise did not receive resonance support from peers’ technical conditions, instead highlighting the extreme overbought risk driven by concentrated capital inflows. Such divergence typically signals significant short-term profit-taking pressure.

Observing market comments, sentiment has shifted from earlier观望 (cautious observation) to obvious excitement. Some investors have started raising their target prices, such as looking at 11.8 or even above 13, with some voices expecting continuous new highs; at the same time, emotional remarks like 'going straight up' and 'shouldn’t have exited earlier' appear, reflecting the uptrend attracting capital chasing. However, on the other side, some investors mentioned being shaken out, missing lower entry points, or prematurely reducing positions and thus missing out on gains, showing that divergence at higher levels is starting to emerge.
Common questions mainly focus on two directions:
The first is how much the target price should be, and whether there is still room for further increases;
The second is whether it is still suitable to chase in at this stage.
Overall, the market focus has shifted from 'whether the bottom has been reached' to 'how much more can it rise,' which typically appears in the later stages of an uptrend.
In terms of technical trend consolidation, the current price is significantly above the middle axis of the Bollinger Band at 10.063, maintaining a strong overall structure. However, the Relative Strength Index (RSI) has risen above 80, indicating an overheated level. This shows that while short-term momentum is strong, the pressure for a pullback is also accumulating. At this stage, the most critical level remains the watershed at 11.248; as long as it holds, the uptrend can be sustained. But if there is no effective breakout above 11.730, the likelihood is that the market will consolidate at higher levels first.
Strategically, only a breakout above 11.730 offers the potential to move further towards new highs. Otherwise, near the upper rail region, the risk-reward ratio of chasing the stock has noticeably declined, necessitating caution regarding short-term pullback risks.
Restoring some investors' viewpoints:
@賺大錢開心快樂 The market remains strong at present, but in the short term, we'll first watch whether 11.730 can be broken through before determining upside potential.
@寶劍與斗美The recent upward movement has primarily been driven by capital inflows, with technical trends still being the dominant factor.
@26991285 The uptrend is indeed strong at this stage, but it is approaching a resistance zone, so consolidation needs to be monitored.
Based on the above analysis, the strategies for deployment can be divided into the following main approaches:

For more market analysis, stay tuned to Jenny's daily updates on 'Hong Kong Stock Warrants'!
Reminder: This article does not constitute any investment advice.
This article is for reference only and does not constitute any investment advice. The market data, opinions, and analysis contained herein may change at any time without prior notice. We are not responsible for any loss or damage caused by reliance on the information in this article. Technical analysis only shows whether certain technical conditions are met; a comprehensive assessment of asset performance should be conducted using additional data. Decisions to trade should not be based solely on this article. Please note that past performance is not indicative of future results.
#HKStocks #LenovoGroup #RealTimeAnalysis #WarrantPicks #WarrantStrategy #DerivativesHedging #HKStocksWarrantsJenny #BlueChipStocks #TechnicalAnalysis
Risk Disclaimer: The above content only represents the author's view. It does not represent any position or investment advice of Futu. Futu makes no representation or warranty.Read more
Comments
to post a comment