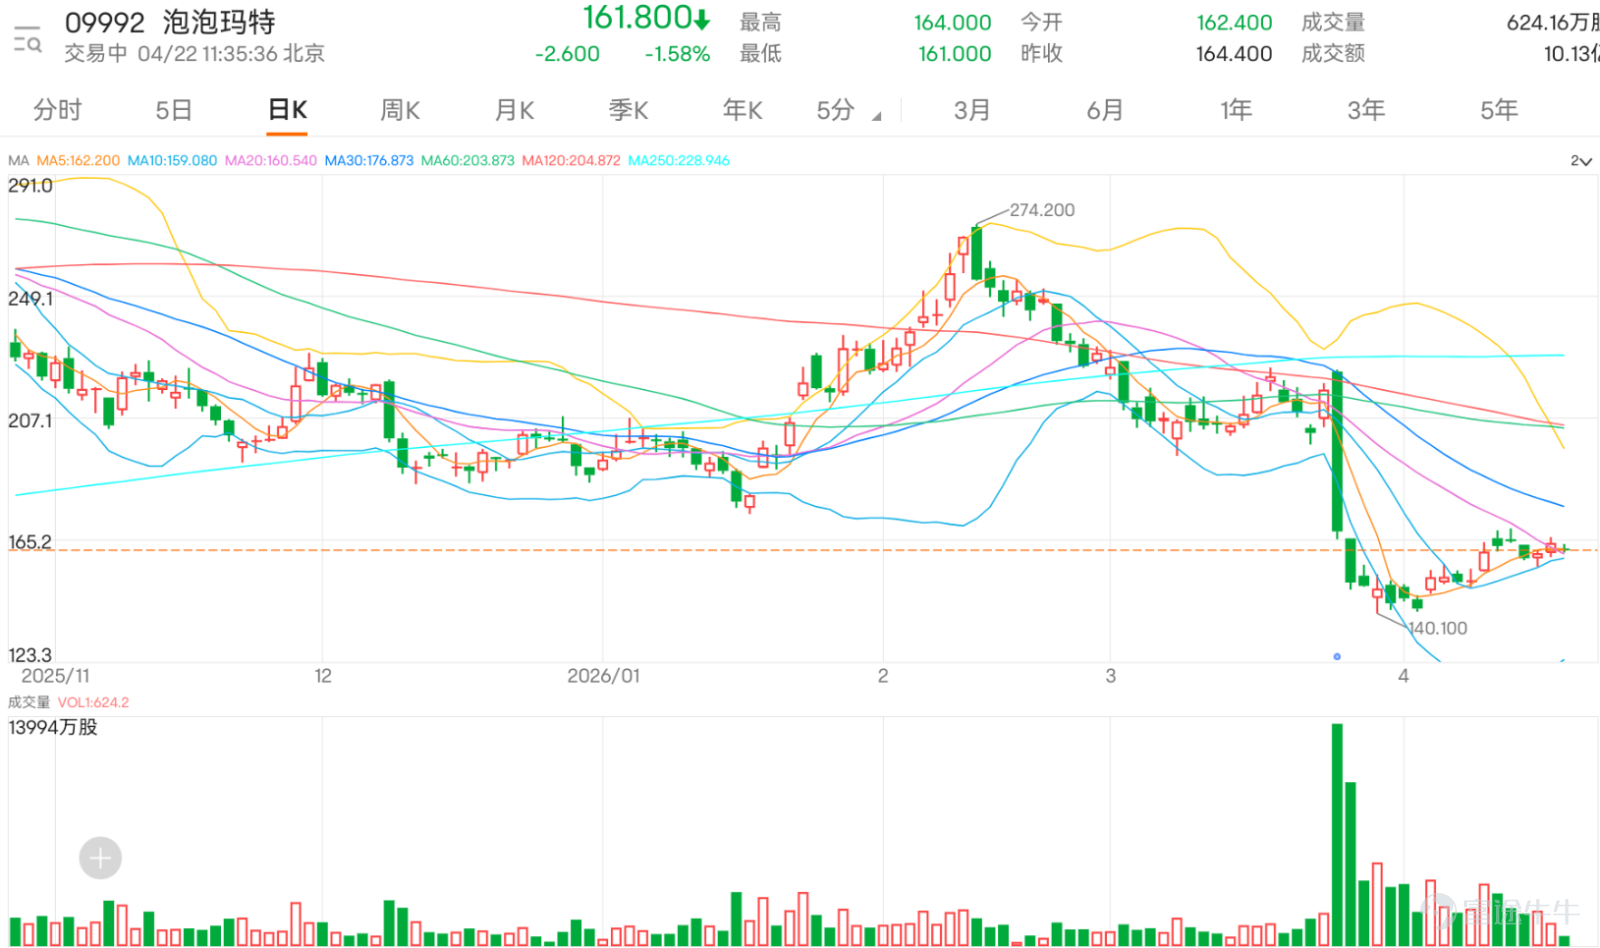
Pop Mart surges then retreats, with 159.5 yuan becoming the key short-term support
$POP MART (09992.HK)$ The early session saw a high of 164 yuan, followed by volatile pullbacks, with an intraday low of 161 yuan testing the 20-day line (160.5 yuan) support level; the current trend is still in the stage of lower-position recovery and has not yet established a definitive upward trajectory.
From the comments, market sentiment has clearly improved compared to before, with more investors leaning toward optimism. Many investors are now revising their outlook higher for future sessions, even directly eyeing targets of 180 yuan, 190 yuan, or 200 yuan. Some believe that bears are retreating and that stock prices will be hard to suppress further, reflecting growing expectations for the continuation of the rebound. However, on the other hand, some investors remain concerned about major players’ movements, large-capital flows, afternoon pullbacks, fluctuations at higher levels, and even think there’s a chance of renewed weakness after the half-year report, showing that although confidence is recovering, market divergence remains.
The most common questions currently revolve around three aspects. First, whether the resistance zone between 164 yuan and 166.400 yuan can be effectively broken; second, whether the current rebound is merely a correction or a true strengthening; third, whether to chase in at the current level or wait for a pullback. Technically speaking, as long as the stock price stabilizes above 159.500 yuan, the short-term recovery pattern can continue. If it breaks through 166.400 yuan, the rebound may extend further and market expectations for a target near 180 yuan will rise. Conversely, if it fails to break through and falls below 159.500 yuan, one must beware of the stock price retesting the support near 152.734 yuan, returning to a more volatile range in the short term.
In terms of betting value, the current situation is neutral. The Relative Strength Index has rebounded to above 58, indicating some improvement in short-term momentum but not overheating. The Bollinger Bands' midline sits at 162.930, and the current price is slightly above this midline, with trends stabilizing somewhat. However, since the resistance at 166.400 has not been broken yet, it's more suitable to observe whether there are further breakout signals rather than assuming a full reversal has occurred. If resistance is breached, the recovery pattern could upgrade into a clearer rebound trend. Key considerations: 159.500 yuan serves as the short-term watershed—holding above it allows for continued lower-position recovery and another attempt at 166.400. If 166.400 is broken, the rebound may extend further. If 159.500 is lost, beware of a retest of 152.734, with short-term positioning shifting from chasing rebounds to defense.

Strategy One | Absorb on dips after securing the watershed for a rebound play
$UBPOMRT@EC2711A.C (27929.HK)$ |Strike Price 180.1|Actual Leverage 1.8x|Out-of-the-money by approx. 9.6%, a relatively stable and slow-paced option, suitable for those optimistic about the stock price stabilizing first at the watershed level, then leveraging lower volatility to bet on a continued rebound.
$UBPOMRT@EC2609C.C (27773.HK)$ |Strike Price 186.88|Actual Leverage 4.0x|Out-of-the-money by approx. 13.7%, offers higher flexibility compared to the previous one; suitable for gaining enhanced upside exposure after stabilization without being too aggressive.
$CTPOMRT@EC2609D.C (28018.HK)$ |Strike Price 186.78|Actual Leverage 4.5x|Also a rebound play but with higher explosiveness; more suitable for capturing faster upward momentum when seeing sustained buying interest.
Strategy Two|Follow the uptrend after breaking through 166.400
$UBPOMRT@EP2612A.P (25120.HK)$ |Strike Price 165.9|Actual Leverage 2.2x|A near-the-money UBS Group choice, suitable for following up after truly breaking through resistance; key features include proximity to the current price and direct responsiveness.
$HUPOMRT@EC2609B.C (28008.HK)$ |Strike Price 190.02|Actual Leverage 4.8x|Out-of-the-money by approx. 15.6%, a mid-to-high elasticity momentum play, ideal for accelerating gains after a breakout.
$GJPOMRT@EC2610B.C (27787.HK)$ |Strike Price 193|Actual Leverage 4.2x|Slightly more stable than the previous one; suitable for following the trend after confirming a breakout but avoiding overly aggressive products.
Strategy Three|Switch to defense after falling below 159.500
$UBPOMRT@EP2607A.P (22558.HK)$ |Strike Price 162.82|Actual Leverage 3.9x|A relatively near-the-money put option; suitable for quickly reversing position after breaching the watershed, with high sensitivity towards testing support at 152.734.
$BPPOMRT@EP2607A.P (24971.HK)$ |Strike Price 162.9|Actual Leverage 4.1x|Higher elasticity; suitable for short-selling after the breakdown extends downward pressure, geared towards short-term efficiency-focused positioning.
$HSPOMRT@EP2608A.P (22347.HK)$|Strike Price 162.92|Actual Leverage 3.8x|Positioned between the two, suitable for those wanting to implement defensive hedging without immediately resorting to the most aggressive put options.
Reply to some investors' views:
@24682338If it can break through 166.400, market expectations around the 200-level will naturally heat up again, but this stage has not yet been reached.
@231874206The recent trend has indeed been more stable than before, but it hasn't completely broken out of the recovery pattern.
@大飞For this week to push towards 180 to 190, the precondition remains a valid breakout above 166.400 first.
@买了600009、600004If it fails to hold above 159.500, short-term pullback pressure will indeed increase.
@我是个小白At this stage, it appears to be more like a post-correction recovery, but whether the correction is complete still depends on whether 159.500 can hold steady.
Reminder: This article does not constitute any investment advice.
This article is for reference only and does not constitute any investment advice. The market data, opinions, and analysis contained herein may change at any time without prior notice. We are not responsible for any loss or damage caused by reliance on the information in this article. Technical analysis only shows whether certain technical conditions are met; a comprehensive assessment of asset performance should be conducted using additional data. Decisions to trade should not be based solely on this article. Please note that past performance is not indicative of future results.
#HKStocks #RealTimeAnalysis #WarrantPick #WarrantGuide #DerivativesHedging #HKWarrantsJenny #POP MART #09992 #BlueChipStock #TechnicalAnalysis$Hang Seng Index (800000.HK)$$Hang Seng TECH Index (800700.HK)$
Risk Disclaimer: The above content only represents the author's view. It does not represent any position or investment advice of Futu. Futu makes no representation or warranty.Read more
Comment (1)
to post a comment