English
Back
Open Account
港股窩輪Jenny
wrote a post ·

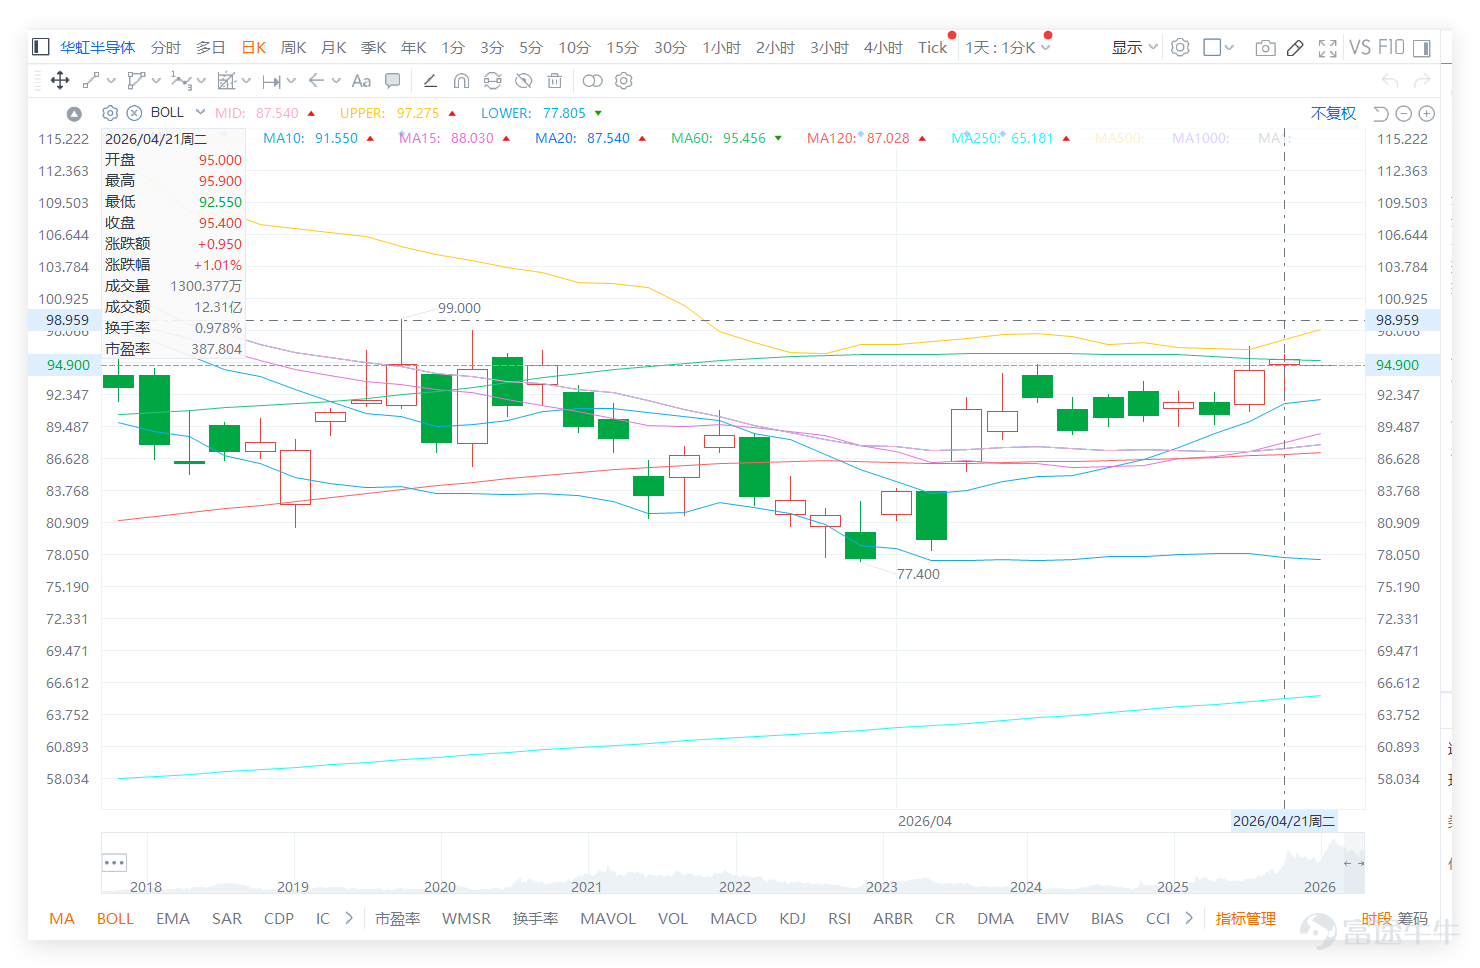
Hua Hong's rebound enters a high-pressure zone, with 92.55 yuan becoming the watershed between strength and weakness

The recent trend has shown continuous improvement. After rebounding from the low of 77.4, the stock price has steadily risen. On the previous day (the 21st), it closed at 95.4, breaking above multiple short-term moving averages, indicating a clear strengthening in the short-term structure. The stock price on that day approached the short-term high of 95.9 while nearing the upper Bollinger Band, reflecting ongoing upward momentum but also showing increasing resistance above. Before pushing further upward in the short term, the market will be particularly sensitive to whether it can break through.
$HUA HONG SEMI (01347.HK)$ The recent trend has shown continuous improvement. After rebounding from the low of 77.4, the stock price has steadily risen. On the previous day (the 21st), it closed at 95.4, breaking above multiple short-term moving averages, indicating a clear strengthening in the short-term structure. The stock price on that day approached the short-term high of 95.9 while nearing the upper Bollinger Band, reflecting ongoing upward momentum but also showing increasing resistance above. Before pushing further upward in the short term, the market will be particularly sensitive to whether it can break through. Looking at the semiconductor and integrated circuit sectors, the market generally rose on the previous day (the 21st) $SHANGHAI FUDAN (01385.HK)$ Up 2.00%, Hua Hong Semiconductor up 1.01% $SMIC (00981.HK)$ Up 0.50%, only $TIMES ELECTRIC (03898.HK)$ Slight decline. However, technical signals show divergence: despite rising prices, both Hua Hong Semiconductor and Shanghai Fudan have "neutral" technical signals accompanied by "strong sell" oscillation indicator signals, indicating significant profit-taking pressure has accumulated in the short-term rally. In contrast, SMIC’s technical outlook is neutral-to-bullish, while CRRC Times Electric received a "buy" signal. Notably, Hua Hong’s stock price is challenging the MA60 (around 95.46 yuan) key resistance level. Its technical structure is similar to that of Shanghai Fudan, both being at a critical juncture where they face pressure after a rebound. This indicates that Hua Hong's strengthening offensive is occurring amidst overall improved sentiment in the sector, yet individual stock technicals already suggest hidden selling pressure. Whether it can break through 95...
Looking at the semiconductor and integrated circuit sectors, the market generally rose on the previous day (the 21st) $SHANGHAI FUDAN (01385.HK)$ Up 2.00%, Hua Hong Semiconductor up 1.01% $SMIC (00981.HK)$ Up 0.50%, only $TIMES ELECTRIC (03898.HK)$ Slight decline. However, technical signals show divergence: despite rising prices, both Hua Hong Semiconductor and Shanghai Fudan have "neutral" technical signals accompanied by "strong sell" oscillation indicator signals, indicating significant profit-taking pressure has accumulated in the short-term rally.
$HUA HONG SEMI (01347.HK)$ The recent trend has shown continuous improvement. After rebounding from the low of 77.4, the stock price has steadily risen. On the previous day (the 21st), it closed at 95.4, breaking above multiple short-term moving averages, indicating a clear strengthening in the short-term structure. The stock price on that day approached the short-term high of 95.9 while nearing the upper Bollinger Band, reflecting ongoing upward momentum but also showing increasing resistance above. Before pushing further upward in the short term, the market will be particularly sensitive to whether it can break through. Looking at the semiconductor and integrated circuit sectors, the market generally rose on the previous day (the 21st) $SHANGHAI FUDAN (01385.HK)$ Up 2.00%, Hua Hong Semiconductor up 1.01% $SMIC (00981.HK)$ Up 0.50%, only $TIMES ELECTRIC (03898.HK)$ Slight decline. However, technical signals show divergence: despite rising prices, both Hua Hong Semiconductor and Shanghai Fudan have "neutral" technical signals accompanied by "strong sell" oscillation indicator signals, indicating significant profit-taking pressure has accumulated in the short-term rally. In contrast, SMIC’s technical outlook is neutral-to-bullish, while CRRC Times Electric received a "buy" signal. Notably, Hua Hong’s stock price is challenging the MA60 (around 95.46 yuan) key resistance level. Its technical structure is similar to that of Shanghai Fudan, both being at a critical juncture where they face pressure after a rebound. This indicates that Hua Hong's strengthening offensive is occurring amidst overall improved sentiment in the sector, yet individual stock technicals already suggest hidden selling pressure. Whether it can break through 95...
In contrast, SMIC’s technical outlook is neutral-to-bullish, while CRRC Times Electric received a "buy" signal. Notably, Hua Hong’s stock price is challenging the MA60 (around 95.46 yuan) key resistance level. Its technical structure is similar to that of Shanghai Fudan, both being at a critical juncture where they face pressure after a rebound.
This indicates that Huahong’s strengthening upward movement occurs in an environment where overall sector sentiment has improved, but individual stock technicals already show signs of selling pressure. Whether it can break through HKD 95.9 depends not only on its own momentum but also on whether peers (especially stocks facing strong sell signals) can digest short-term overbought pressure.
From the comments, market sentiment appears quite divided. On one side, some investors are optimistic about the pattern, believing the stock price could rise further to HKD 100 or even higher; others are inclined to chase due to improved technical trends. On the other hand, there are concerns that the current price may just be a bull trap, with noticeable selling pressure at high levels, and expectations of significant fluctuations around earnings announcements. This reflects that although the market acknowledges Huahong’s recovery from lows, above HKD 95, investor sentiment has shifted from early optimism to a standoff between breakout hopes and profit-taking.
Common questions revolve around several aspects, including whether the current price is suitable for chasing, whether HKD 95 can hold firm, whether the short term can push to HKD 100, and if resistance is met, whether it will retest near HKD 91. The core behind these discussions is essentially the same issue: Huahong’s technical situation has clearly improved but has now approached the resistance zone. Investors’ primary concern is no longer whether there will be a rebound, but whether this rally can advance further.
Technically, HKD 92.55 is the most important short-term watershed. As long as the stock price stays above it, the overall strong structure can be maintained. If it breaks through HKD 95.9, there is potential to test HKD 97.28, further fueling market expectations for the HKD 100 mark. However, if it subsequently falls below HKD 92.55, beware of slowing upward momentum, with the stock possibly retesting support near HKD 91.55. Currently, the relative strength index has risen above 70, indicating strong short-term momentum entering overheated levels. Though the bias remains positive, the safety margin for chasing higher is significantly reduced compared to the early stages of the rebound.
Overall, Huahong Semiconductor's current risk-reward ratio is neutral. The stock price has strengthened but is approaching the resistance zone. The crucial factor is not how hot market sentiment is but whether HKD 95.9 can truly break and hold steady. If successful, there is potential for further gains in the short term; if not, consolidation at high levels is more likely. For investors who already own shares, it is worth monitoring whether HKD 92.55 can hold; for those without positions, blindly chasing at high levels solely based on improving sentiment is not advisable.
Reply to some investors' views:
@勢頭發掘機 The pattern has indeed improved, but to surge directly to $100, it still needs to first overcome the resistance at $95.9.
@Onlai7 If there's a successful short-term breakout, the market will naturally look higher, but for now, the focus remains on whether the resistance level can be breached.
@韭菜羊 This position has been consolidating for two weeks, clearly reflecting significant divergence around the $95 mark.
Based on the above analysis, the strategies for deployment can be divided into the following main approaches:
$HUA HONG SEMI (01347.HK)$ The recent trend has shown continuous improvement. After rebounding from the low of 77.4, the stock price has steadily risen. On the previous day (the 21st), it closed at 95.4, breaking above multiple short-term moving averages, indicating a clear strengthening in the short-term structure. The stock price on that day approached the short-term high of 95.9 while nearing the upper Bollinger Band, reflecting ongoing upward momentum but also showing increasing resistance above. Before pushing further upward in the short term, the market will be particularly sensitive to whether it can break through. Looking at the semiconductor and integrated circuit sectors, the market generally rose on the previous day (the 21st) $SHANGHAI FUDAN (01385.HK)$ Up 2.00%, Hua Hong Semiconductor up 1.01% $SMIC (00981.HK)$ Up 0.50%, only $TIMES ELECTRIC (03898.HK)$ Slight decline. However, technical signals show divergence: despite rising prices, both Hua Hong Semiconductor and Shanghai Fudan have "neutral" technical signals accompanied by "strong sell" oscillation indicator signals, indicating significant profit-taking pressure has accumulated in the short-term rally. In contrast, SMIC’s technical outlook is neutral-to-bullish, while CRRC Times Electric received a "buy" signal. Notably, Hua Hong’s stock price is challenging the MA60 (around 95.46 yuan) key resistance level. Its technical structure is similar to that of Shanghai Fudan, both being at a critical juncture where they face pressure after a rebound. This indicates that Hua Hong's strengthening offensive is occurring amidst overall improved sentiment in the sector, yet individual stock technicals already suggest hidden selling pressure. Whether it can break through 95...
For more market analysis, stay tuned to Jenny's daily updates on 'Hong Kong Stock Warrants'!
Reminder: This article does not constitute any investment advice.
This article is for reference only and does not constitute any investment advice. The market data, opinions, and analysis contained herein may change at any time without prior notice. We are not responsible for any loss or damage caused by reliance on the information in this article. Technical analysis only shows whether certain technical conditions are met; a comprehensive assessment of asset performance should be conducted using additional data. Decisions to trade should not be based solely on this article. Please note that past performance is not indicative of future results.
#HKStocks #HuaHongSemiconductor #Real-TimeAnalysis #WarrantSelection #WarrantGuide #DerivativesHedging #HKWarrantsJenny #Blue-ChipStocks #TechnicalAnalysis
Risk Disclaimer: The above content only represents the author's view. It does not represent any position or investment advice of Futu. Futu makes no representation or warranty.Read more
158K Views
Report
Comments
Write a Comment...