The S&P 500 has risen for seven consecutive weeks—should you chase the rally or take profits?

Daily Options Selling Strategy | BTC Reclaims $75,000, MSTR Surges Nearly 12% in a Day: How to Smartly Use Options for Strategic Positioning?
I. Market Barometer: BTC Reclaims Above $75,000; US Stocks Encounter Headwinds After Consecutive Gains
In the previous trading session, the three major US indices closed higher across the board, with various indices repeatedly hitting new highs, led by tech growth stocks driving the broader market. $Bitcoin (BTC.CC)$ Last Friday, BTC reclaimed above $75,000 and briefly surged to $78,000. Over the weekend, influenced by fluctuations in the US-Iran situation, the price retreated somewhat. As of this writing, BTC is fluctuating around $75,000.
As of this writing, the progress of US-Iran negotiations remains unclear, with all three major US futures indices declining.
II. Focus on Hot Targets
$Strategy (MSTR.US)$: Bitcoin's Wall Street Barometer: Leveraged Accumulation Strategies Amplify Volatility
As an encrypted reserve concept stock deeply tied to BTC, MSTR closed at $166.52 on the previous trading day (April 17), surging 11.80% in a single day, with a total market capitalization reaching $57.548 billion.
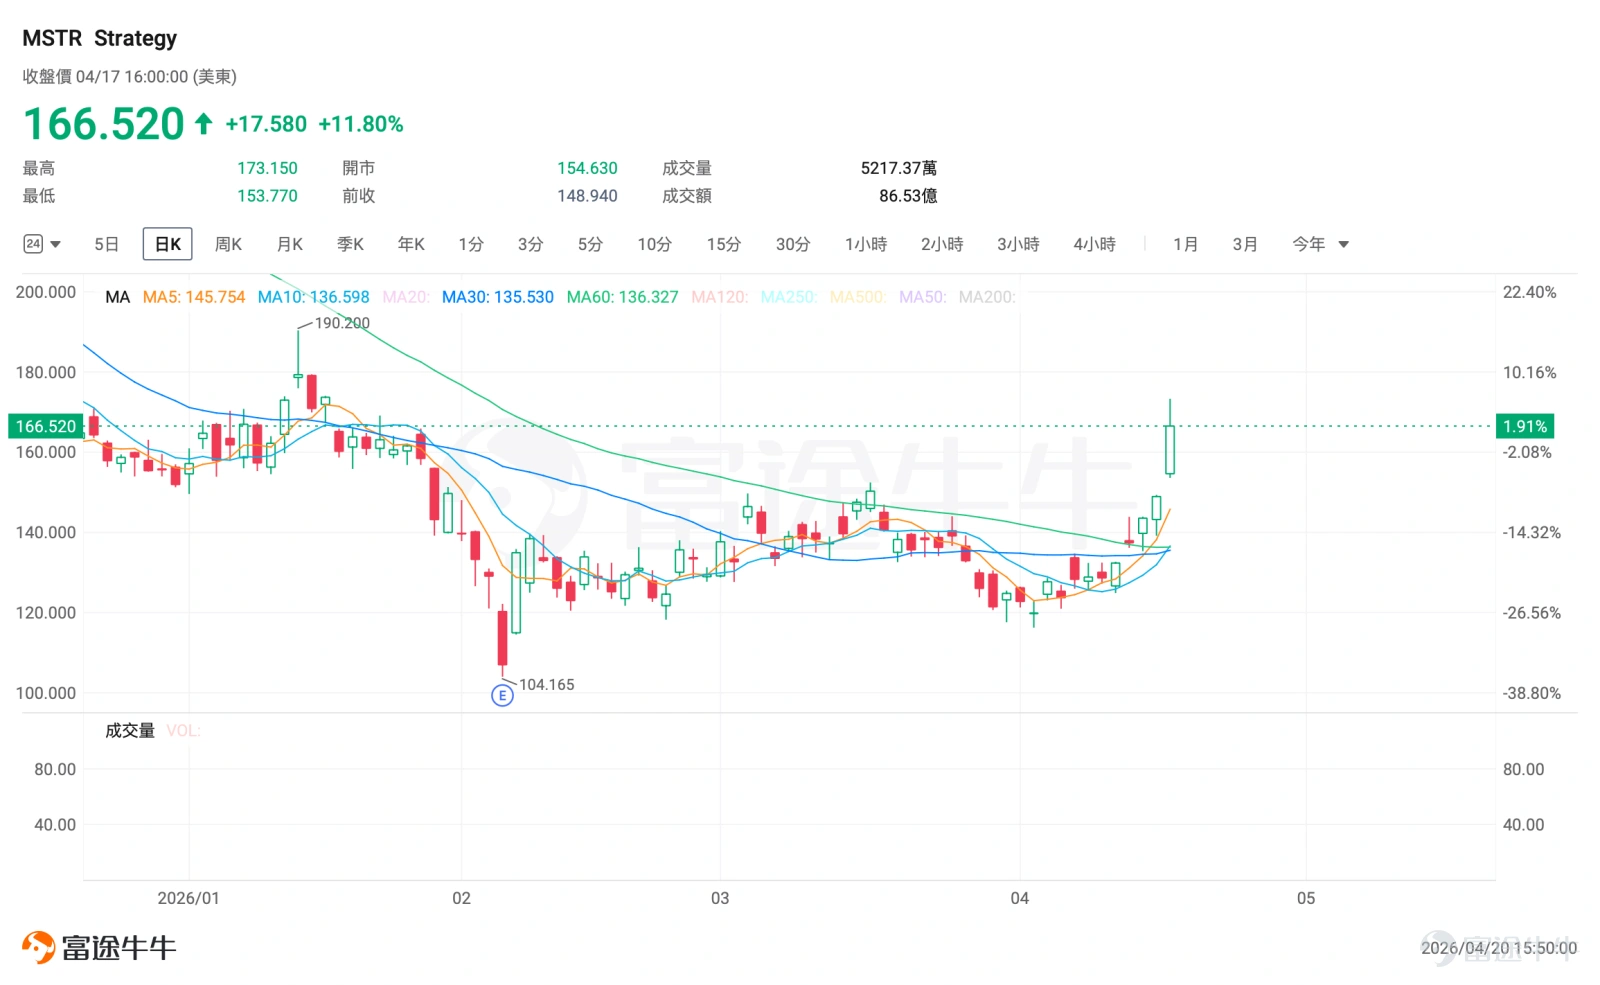
The resonance of Bitcoin holdings and market sentiment boosted the stock price.On April 13, the company announced that it had spent approximately $1 billion purchasing 13,927 Bitcoins in the previous week, with its total holdings soaring to 780,897 Bitcoins, accounting for about 3.7% of the global Bitcoin circulation, just one step away from the 800,000 mark.Large-scale增持 directly boosted market confidence, combined with Bitcoin price breaking through the key level of $75,000, driving a strong rebound in MSTR's stock price.
The company's share price retreated from its previous high of $457 to a low of $104, marking a deep correction. Recently, it rebounded and moved back above the 60-day moving average, forming a strong pattern of consecutive volume increases on the technical side. On April 17, a single-day surge set a new high for the April rebound, establishing an upward channel at the daily chart level with gradually rising lows.In the short term, the company’s MACD indicator is strong, and the rebound appears robust when considering price-volume dynamics, but the RSI indicates overbought conditions, suggesting potential volatility or a pullback.
In the medium term, the weekly chart shows a rising bottom, and the rebound trend has preliminarily taken shape.However, the stock price remains far below the 200-day moving average, indicating that the long-term reversal trend has not yet been established.
III. Seller Options Strategy
1. Sell 1 contract $Strategy (MSTR.US)$ 20260515 135P, estimated required margin (for reference only): $13,500 ($135 × 100)
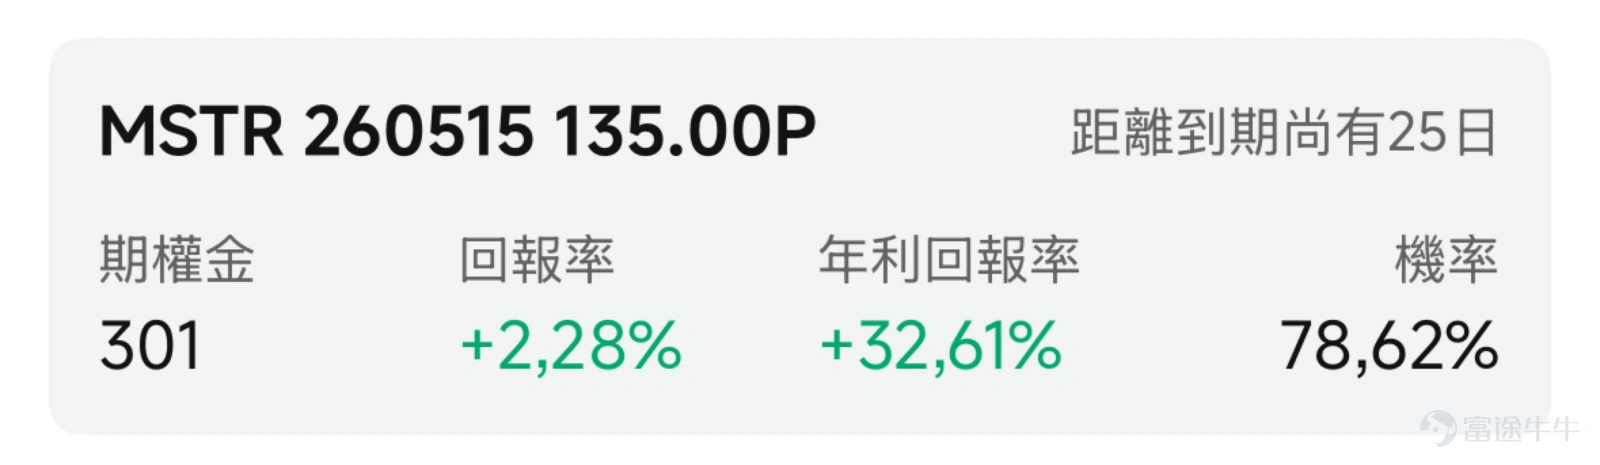
Opportunity filtering logic:
Bitcoin’s rise back above the critical support level of $75,000 is the core logic behind MSTR's surge in trading volume. MSTR's current stock price is still at a historically low level, and the short-term rebound above the 60-day moving average has established a medium-term rebound trend. However, the RSI indicates overbought conditions, signaling caution regarding short-term pullback risks.
The sharp rise in MSTR's stock price has driven up the implied volatility of options, making the options premiums more expensive. At this point, by selling puts,If the stock price continues to rise or stays volatile at higher levels, substantial option premiums can be collected, increasing the annualized return on idle funds. If the stock price pulls back near the strike price, it also allows for acquiring shares at a lower cost and strategically building a position in MSTR.
IV. Risk Control Reminder
Although the seller strategy has a high probability of success, investors must still manage risks effectively:
– Position management is key:The biggest risk for sellers lies in black swan events. It is recommended thatNo more than 20% of total capital should be allocated as margin for any single position. Never sell options beyond your capacity to handle them just for the sake of greedy premium collection.
– Cash-secured put options should beware of 'left-tail risk':For cash-secured puts, if the stock price collapses due to deteriorating fundamentals (rather than a normal pullback), do not hold on stubbornly. At this time, stop losses should be executed, or 'rolling down' can be employed to buy time and wait for volatility to normalize.
Case Selection Criteria
Open Futubull >> Market >> Options >> Seller Zone >> Filter; Common screening criteria for Cash Secured Put and Covered Call strategies: IV Percentile > 40%; Total option volume > 60,000 contracts; Days to expiration 0-45 days; Daily option volume/open interest > 500 contracts; ROI > 2%; Annualized ROI > 30%. Cash Secured Put: OTM Probability > 60%; Covered Call: OTM Probability > 70%;
Underlying selection rule: For each underlying asset, choose the one with the highest probability of profit. Probability refers to the likelihood that the option contract will not be exercised, i.e., the out-of-the-money probability. The higher the probability, the lower the chance of being exercised, and the greater the likelihood of securing stable option premiums. Data source: Futubull. The information is based on closing prices as of the previous trading day; all data and information in the options seller zone are for reference only and do not constitute any investment advice.
 Finally, here's a small perk for fellow investors. Welcome, fellow investors, to claim your benefit.Options Beginner Pack
*This event is exclusive to invited HK users. Click to learn more.Detailed event rules>>
Market conditions are complex and volatile,Options strategyOverwhelmed by choices? Futubull helps you build a portfolio in three steps.Options strategymaking investing simple and efficient from now on!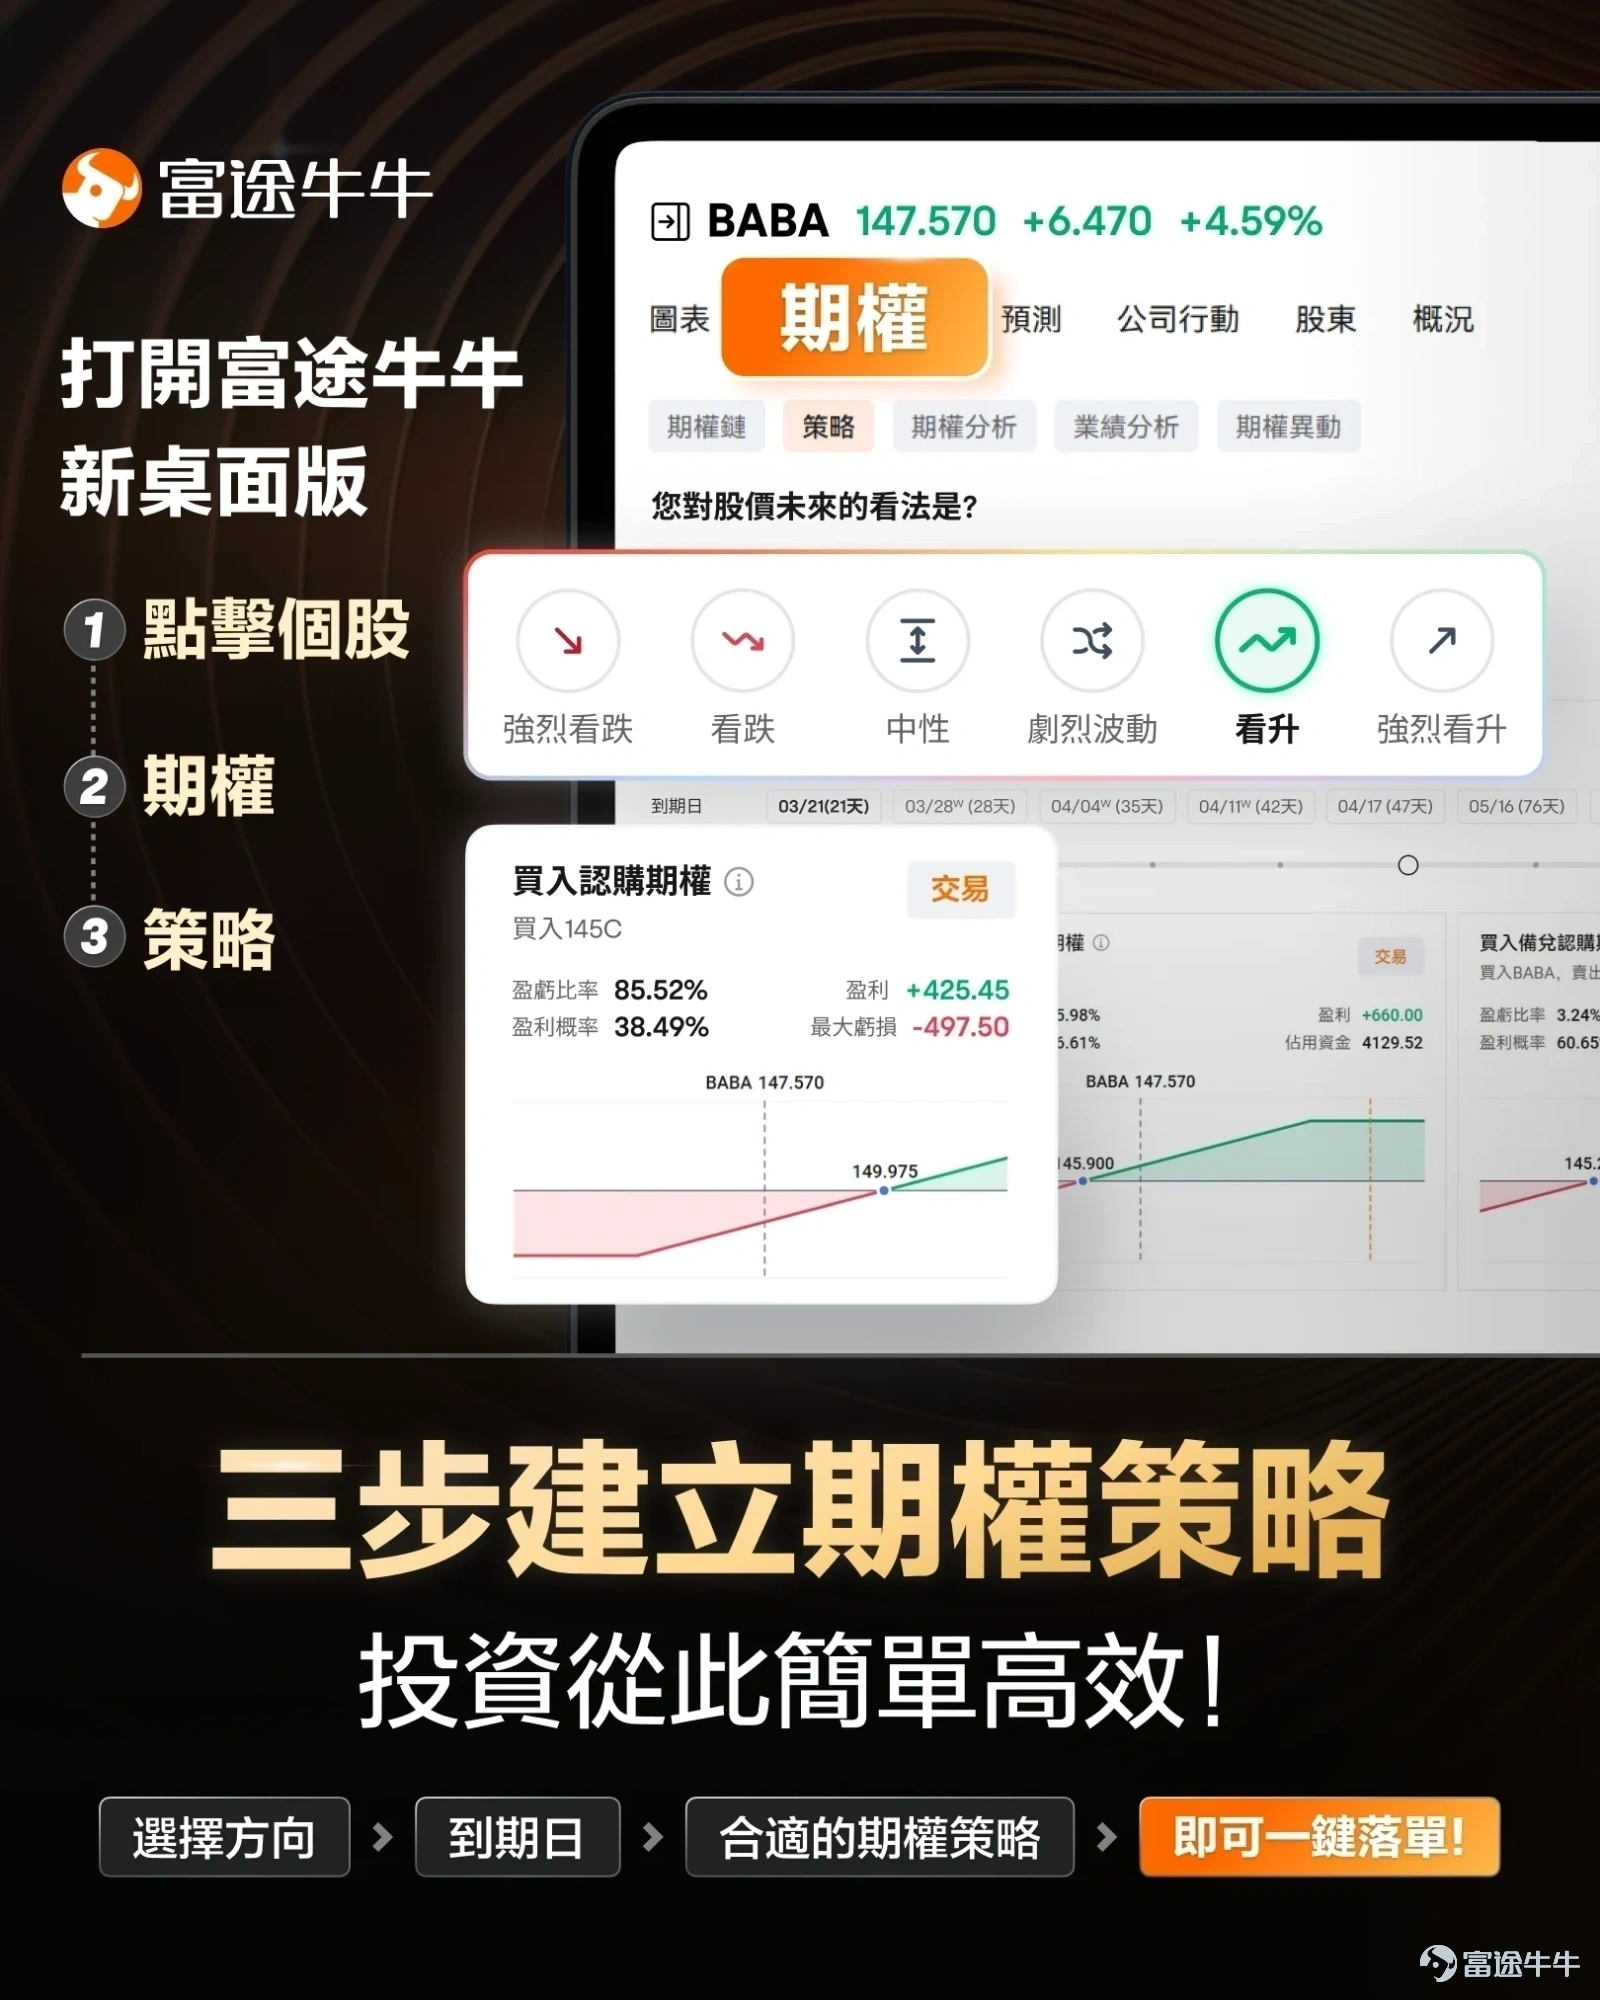
Options Risk Warning
An option is a contract that grants the holder the right, but not the obligation, to buy or sell an asset at a fixed price on a specific date or at any time before that date. The price of an option is influenced by various factors, including the current price of the underlying asset, the strike price, time to expiration, and implied volatility. Implied volatility reflects the market’s expectations for the level of volatility in the option over a future period. It is a data point derived inversely from the Black-Scholes option pricing model and is generally regarded as an indicator of market sentiment. When investors anticipate greater volatility, they may be more willing to pay a higher price for options to hedge risks, resulting in higher implied volatility. Traders and investors use implied volatility to assess the attractiveness of option prices, identify potential mispricings, and manage risk exposure.
Disclaimer
This content does not constitute any offer, solicitation, recommendation, opinion, or guarantee of any securities, financial products, or tools. The risk of loss in trading options can be substantial. In some cases, losses may exceed the initial margin deposited. Even if you set contingent orders such as 'stop-loss' or 'limit' orders, these may not prevent losses. Market conditions may make such orders unexecutable. You may be required to deposit additional margin within a short period. If you fail to provide the required amount within the specified time, your open positions may be liquidated. However, you will still be responsible for any shortfall in your account. Therefore, before trading, you should study and understand options and carefully consider whether such trading is suitable for you based on your financial situation and investment objectives. If you trade options, you should be familiar with the procedures for exercising options and the rights and obligations upon exercise and expiration. Options trading carries extremely high risks and is not suitable for all investors. Investors should carefully readCharacteristics and Risks of Standardized Options。
Risk Disclaimer: The above content only represents the author's view. It does not represent any position or investment advice of Futu. Futu makes no representation or warranty.Read more


Comments
to post a comment
7
8