
English
Back
Open Account
港股窩輪Jenny
wrote a post ·

Hua Hong has stabilized above the short-term moving averages but lacks momentum; the market is waiting for a clear breakout signal.

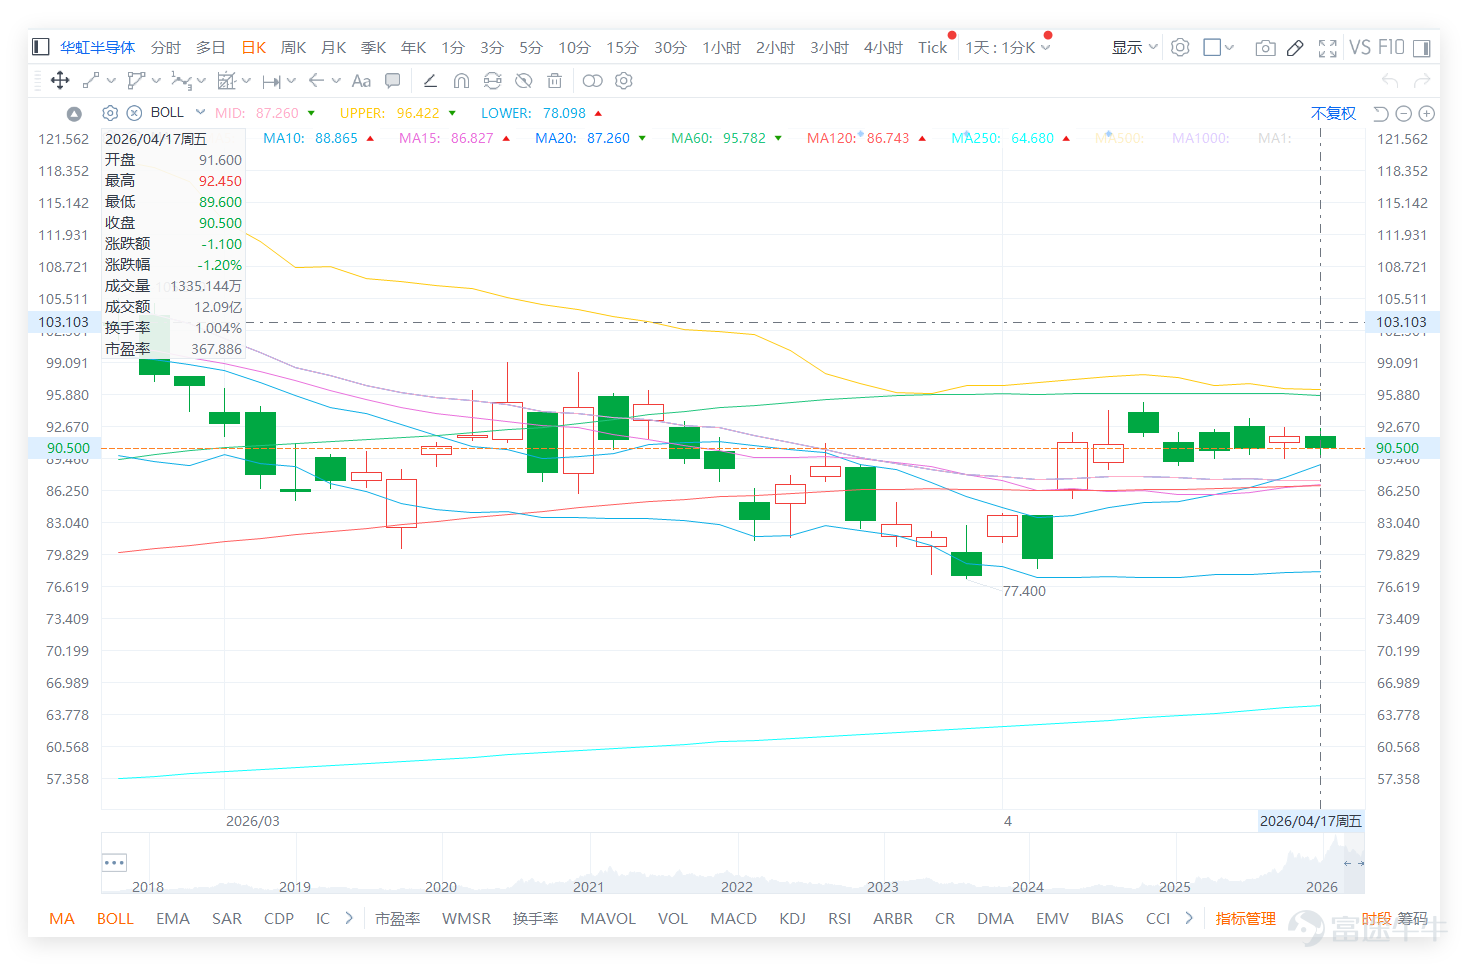
$HUA HONG SEMI (01347.HK)$ On Friday (April 17), the stock closed at HKD 90.5, rebounding gradually from a low of HKD 77.4. On that day, it regained multiple short-term moving averages and returned above the middle axis of the Bollinger Bands, indicating a short-term rebound recovery trend.
$HUA HONG SEMI (01347.HK)$ On Friday (April 17), the stock closed at HKD 90.5, rebounding gradually from a low of HKD 77.4. On that day, it regained multiple short-term moving averages and returned above the middle axis of the Bollinger Bands, indicating a short-term rebound recovery trend. From the perspective of the semiconductor and technology manufacturing sectors, the market showed significant divergence in performance last Friday (April 17). $ASMPT (00522.HK)$ Surging 3.99% and showing extreme overbought conditions (RSI 76), but receiving a 'Strong Sell' signal, with high risk. $SMIC (00981.HK)$ Both Hua Hong and SMIC declined, with technical signals also leaning bearish. In comparison, Hua Hong Semiconductor's technical structure exhibits characteristics of 'repairing within constraints.' Its share price has stabilized above MA10 and MA30 (around HKD 88), indicating a stronger short-term foundation than SMIC’s. However, MA60 (HKD 95.78) forms a strong ceiling overhead. This means that for Hua Hong to meet investors’ expectations of 'reaching HKD 95-97,' it must first overcome the long-term moving average resistance that most peers face. Otherwise, it risks being trapped in range-bound fluctuations with 'support below but no upside breakthrough,' which is the technical root cause of market impatience. Technically, HKD 88.16 remains the most important short-term threshold. As long as the share price holds above it, the overall rebound recovery structure can be maintained. The current price is above the middle axis of the Bollinger Bands at HKD 87.260, indicating relatively stable movement compared to before, but there is strong resistance between HKD 93.93 and HKD 96...
From the perspective of the semiconductor and technology manufacturing sectors, the market showed significant divergence in performance last Friday (April 17). $ASMPT (00522.HK)$ Surging 3.99% and showing extreme overbought conditions (RSI 76), but receiving a 'Strong Sell' signal, with high risk. $SMIC (00981.HK)$ Both Hua Hong and SMIC declined, with technical signals also leaning bearish. In comparison, Hua Hong Semiconductor's technical structure exhibits characteristics of 'repairing within constraints.' Its share price has stabilized above MA10 and MA30 (around HKD 88), indicating a stronger short-term foundation than SMIC’s. However, MA60 (HKD 95.78) forms a strong ceiling overhead. This means that for Hua Hong to meet investors’ expectations of 'reaching HKD 95-97,' it must first overcome the long-term moving average resistance that most peers face. Otherwise, it risks being trapped in range-bound fluctuations with 'support below but no upside breakthrough,' which is the technical root cause of market impatience.
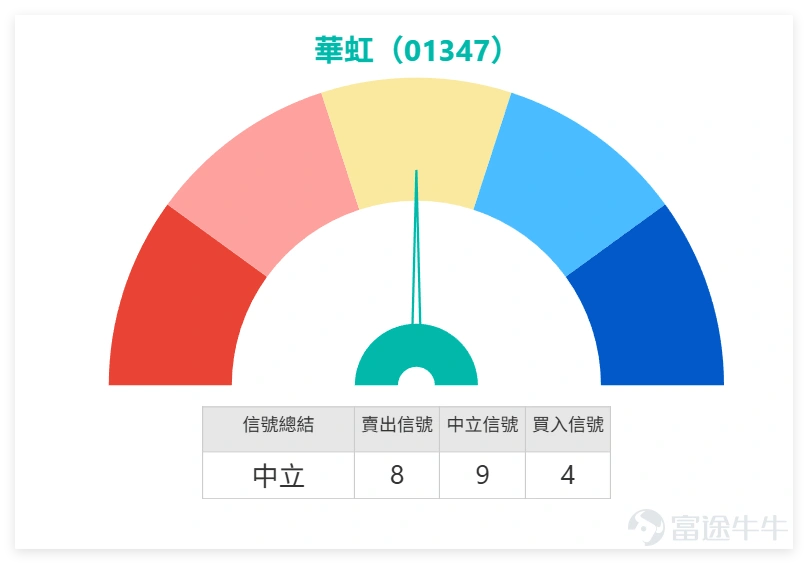
$HUA HONG SEMI (01347.HK)$ On Friday (April 17), the stock closed at HKD 90.5, rebounding gradually from a low of HKD 77.4. On that day, it regained multiple short-term moving averages and returned above the middle axis of the Bollinger Bands, indicating a short-term rebound recovery trend. From the perspective of the semiconductor and technology manufacturing sectors, the market showed significant divergence in performance last Friday (April 17). $ASMPT (00522.HK)$ Surging 3.99% and showing extreme overbought conditions (RSI 76), but receiving a 'Strong Sell' signal, with high risk. $SMIC (00981.HK)$ Both Hua Hong and SMIC declined, with technical signals also leaning bearish. In comparison, Hua Hong Semiconductor's technical structure exhibits characteristics of 'repairing within constraints.' Its share price has stabilized above MA10 and MA30 (around HKD 88), indicating a stronger short-term foundation than SMIC’s. However, MA60 (HKD 95.78) forms a strong ceiling overhead. This means that for Hua Hong to meet investors’ expectations of 'reaching HKD 95-97,' it must first overcome the long-term moving average resistance that most peers face. Otherwise, it risks being trapped in range-bound fluctuations with 'support below but no upside breakthrough,' which is the technical root cause of market impatience. Technically, HKD 88.16 remains the most important short-term threshold. As long as the share price holds above it, the overall rebound recovery structure can be maintained. The current price is above the middle axis of the Bollinger Bands at HKD 87.260, indicating relatively stable movement compared to before, but there is strong resistance between HKD 93.93 and HKD 96...
Technically, HK$88.16 remains the most important short-term watershed. As long as the share price stabilizes above it, the overall rebound and repair structure can be maintained. The current price is above the Bollinger Bands middle axis at HK$87.260, indicating that the trend is more stable compared to before, but resistance between HK$93.93 and HK$96.42 remains significant. Until this range is broken, the overall trend still leans towards consolidation. The Relative Strength Index (RSI) at 56.42 only reflects slight improvement in short-term momentum but not yet strong momentum, corresponding to investors’ perception that the stock is 'rising slowly, lacking volume, and unable to sustain upward moves.'
From investor comments, it's clear that there is noticeable impatience with Hua Hong's current price movement. On one hand, some investors are still hoping for another surge in the afternoon last Friday (May 17), targeting HK$95, HK$97, or even HK$100. On the other hand, more comments focus on feelings such as 'neither rising nor falling,' 'pulling up a bit gets smashed down,' 'lack of volume,' and 'buy now, get trapped now.' These sentiments reflect the general belief that while Hua Hong isn't weak enough to collapse entirely, it also lacks sufficient momentum for a real breakthrough.
Based on the focus of investors' comments, the market currently faces three main common questions.
First, when will the stock price rebound to RMB 95 or even RMB 97;
Second, does the current weak trend indicate underlying concerns;
Third, with low trading volume, is a rebound likely to be easily reversed?
Based on technical analysis, the most reasonable interpretation at this stage is that Huahong is currently in a rebound recovery phase, but it has not yet upgraded to a clear upward momentum. If the stock price can stabilize above RMB 88.175 and further break through RMB 93.931, there may be a short-term opportunity to test RMB 96.422. At that point, the RMB 95 to RMB 97 range would have a better chance of being challenged; however, if it fails to hold above RMB 88.175, one should beware of the rebound weakening, potentially leading to a retest of support at RMB 87.260.
Overall, Huahong is not completely weak at this time, but before a breakout occurs, it remains more in consolidation rather than a unilateral uptrend. Operations should prioritize confirmation of key levels.
Reply to some investors' views:
@圓活的吳曉波 When can it reach HK$95?
In the short term, it needs to break through HK$93.931 first, then it will have a better chance to challenge HK$95. Until then, fluctuations are more likely to persist.
@Jamin锁螺丝他爹It falls fast but rises slowly. When can it reach HK$97?
In the short term, it needs to break through HK$93.931 first, then test HK$96.422. If it can stabilize above that level, HK$97 will be closer.
@33801400 Without volume, any small rise gets sold off immediately.
This observation is quite close to the current situation. The biggest issue now is that although momentum has improved, there isn’t enough trading volume to support a breakout. Therefore, any rise is easily met with resistance.
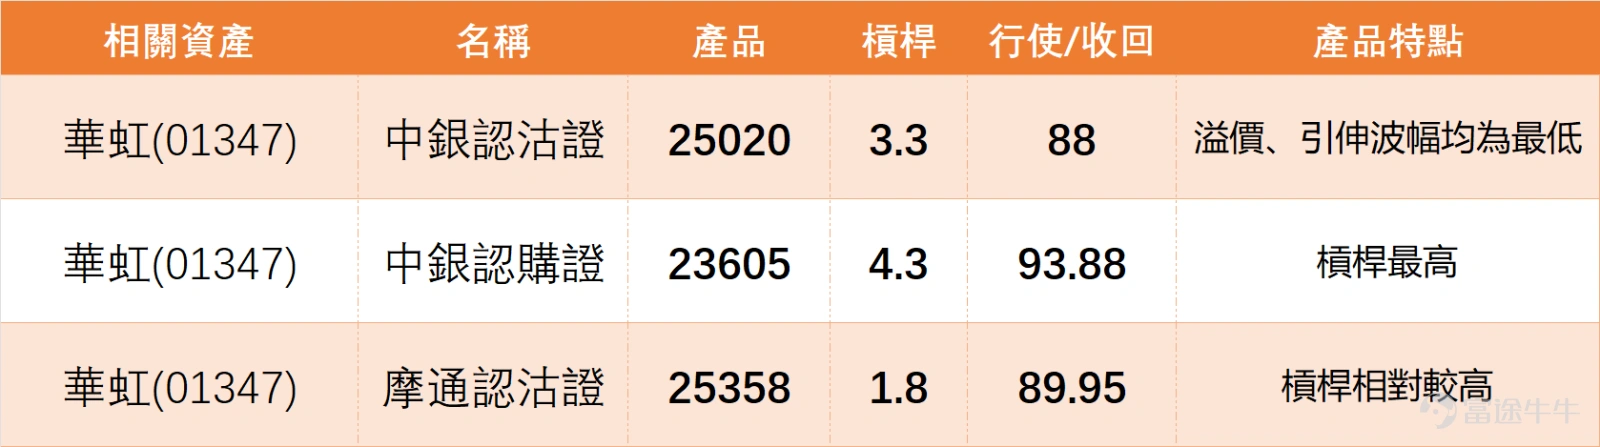
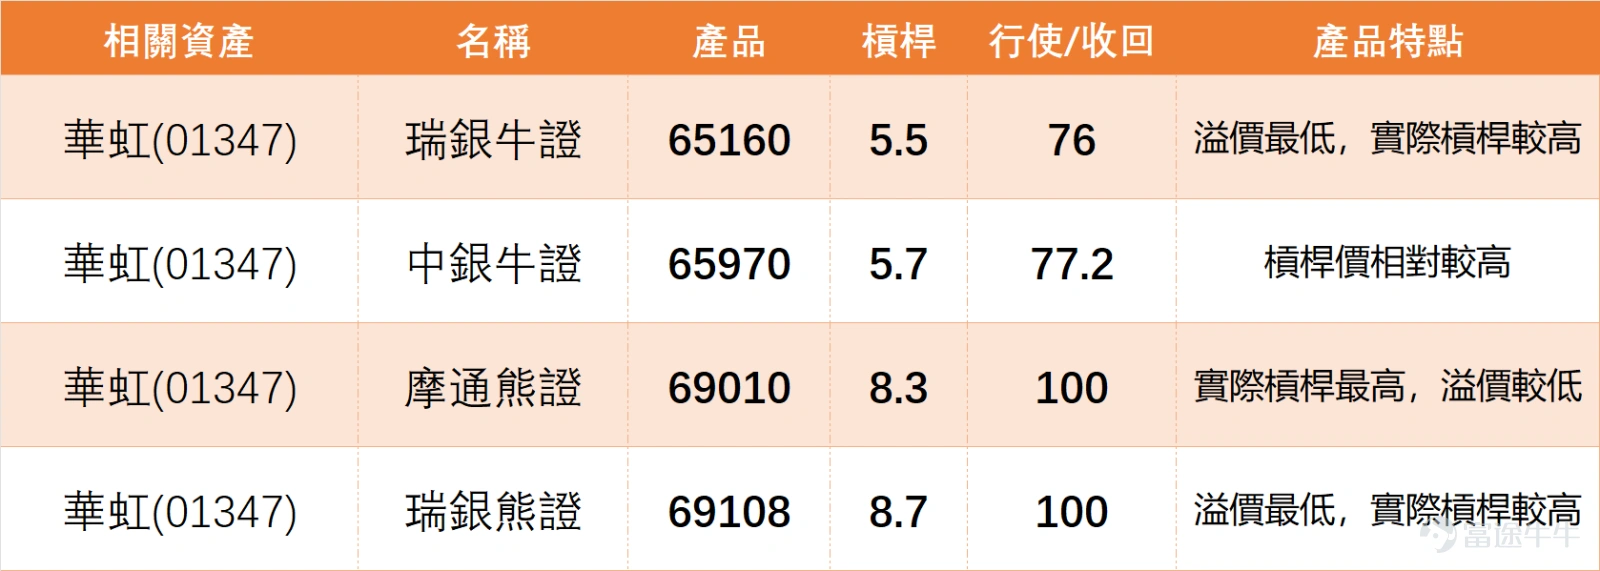
Based on the above analysis, the strategies for deployment can be divided into the following main approaches:
$HUA HONG SEMI (01347.HK)$ On Friday (April 17), the stock closed at HKD 90.5, rebounding gradually from a low of HKD 77.4. On that day, it regained multiple short-term moving averages and returned above the middle axis of the Bollinger Bands, indicating a short-term rebound recovery trend. From the perspective of the semiconductor and technology manufacturing sectors, the market showed significant divergence in performance last Friday (April 17). $ASMPT (00522.HK)$ Surging 3.99% and showing extreme overbought conditions (RSI 76), but receiving a 'Strong Sell' signal, with high risk. $SMIC (00981.HK)$ Both Hua Hong and SMIC declined, with technical signals also leaning bearish. In comparison, Hua Hong Semiconductor's technical structure exhibits characteristics of 'repairing within constraints.' Its share price has stabilized above MA10 and MA30 (around HKD 88), indicating a stronger short-term foundation than SMIC’s. However, MA60 (HKD 95.78) forms a strong ceiling overhead. This means that for Hua Hong to meet investors’ expectations of 'reaching HKD 95-97,' it must first overcome the long-term moving average resistance that most peers face. Otherwise, it risks being trapped in range-bound fluctuations with 'support below but no upside breakthrough,' which is the technical root cause of market impatience. Technically, HKD 88.16 remains the most important short-term threshold. As long as the share price holds above it, the overall rebound recovery structure can be maintained. The current price is above the middle axis of the Bollinger Bands at HKD 87.260, indicating relatively stable movement compared to before, but there is strong resistance between HKD 93.93 and HKD 96...
For more market analysis, stay tuned to Jenny's daily updates on 'Hong Kong Stock Warrants'!
Reminder: This article does not constitute any investment advice.
This article is for reference only and does not constitute any investment advice. The market data, opinions, and analysis contained herein may change at any time without prior notice. We are not responsible for any loss or damage caused by reliance on the information in this article. Technical analysis only shows whether certain technical conditions are met; a comprehensive assessment of asset performance should be conducted using additional data. Decisions to trade should not be based solely on this article. Please note that past performance is not indicative of future results.
#Hong Kong stocks # #Hua Hong #Real-time analysis #Warrants selection #Warrants strategy #Derivatives hedging #Hong Kong stock warrants Jenny #Blue chips #Technical analysis
Risk Disclaimer: The above content only represents the author's view. It does not represent any position or investment advice of Futu. Futu makes no representation or warranty.Read more
128K Views
Report
Comment (1)
Write a Comment...
1