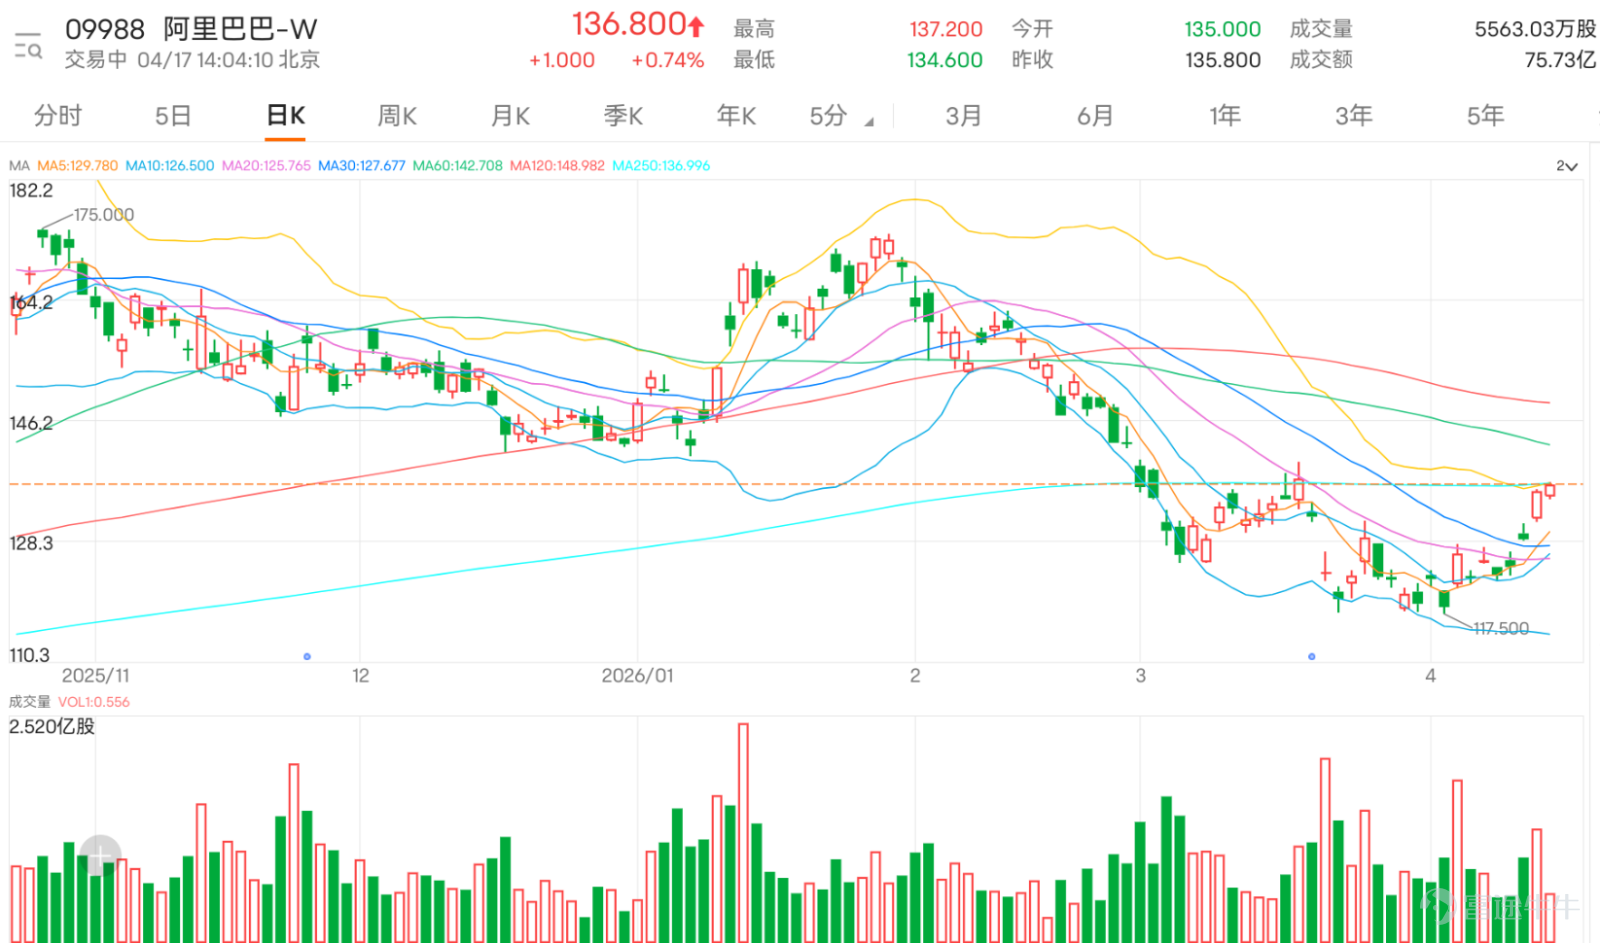

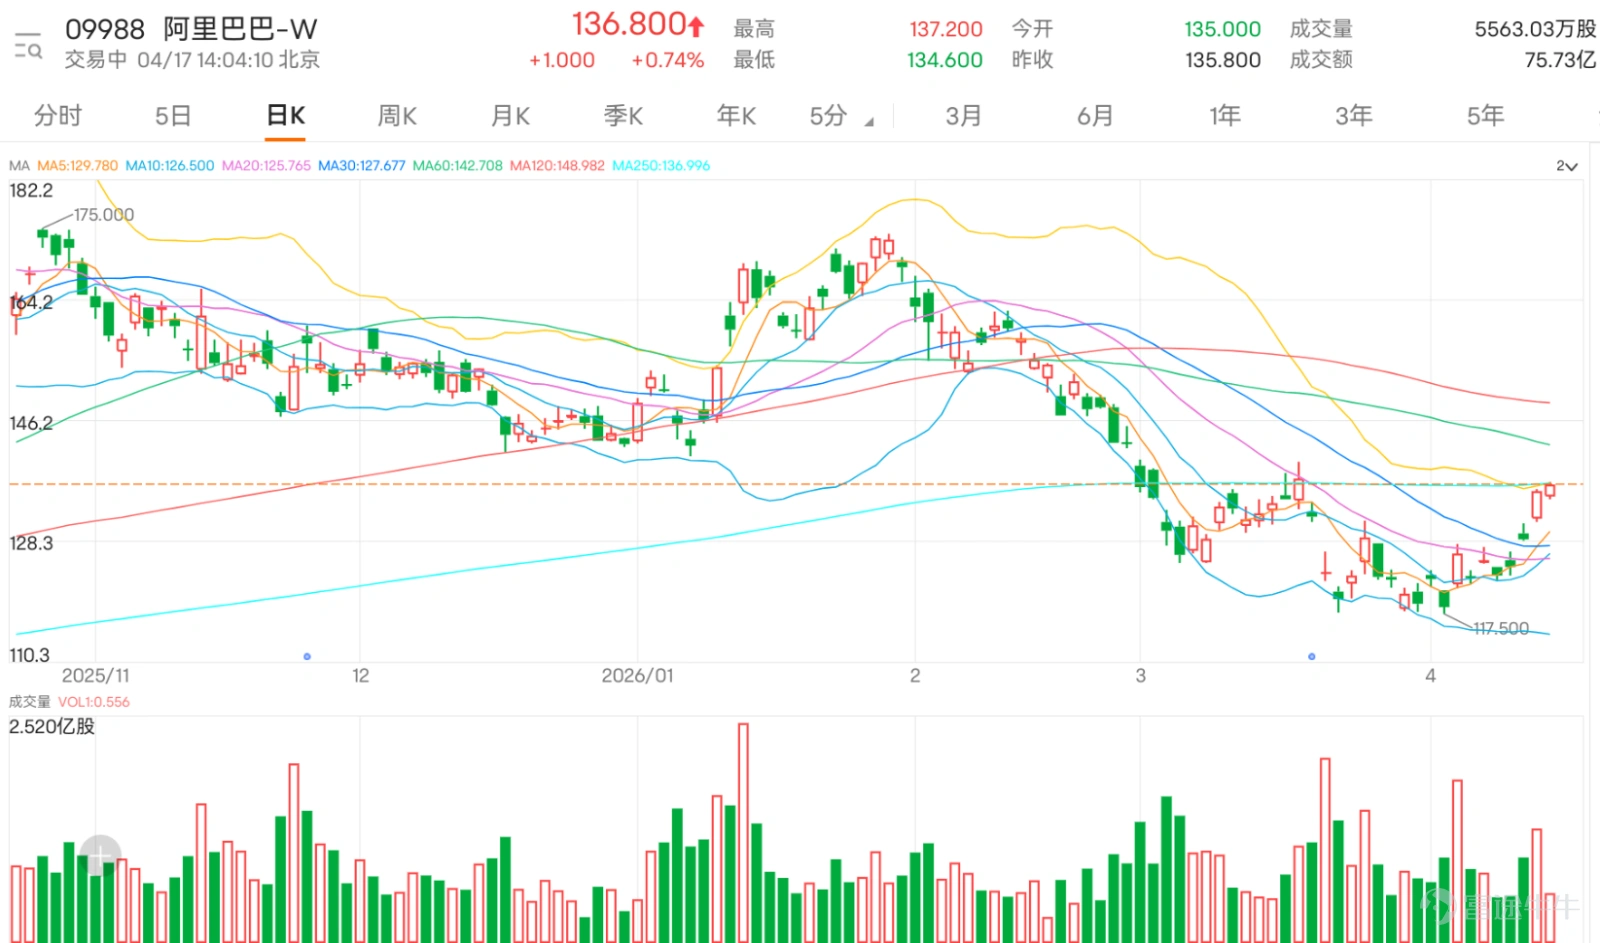
Alibaba is testing the resistance zone, with a strong rebound but increasing divergence at higher levels.
$BABA-W (09988.HK)$ The current price is HKD 136.8. The stock has been recovering steadily after bouncing from its lows and has now risen above the 5-day, 10-day, and 20-day moving averages. The short-term structure has clearly improved, showing a strong rebound trend. However, the current price is approaching the upper Bollinger Band and is also close to the resistance level of HKD 136.57, indicating that although upward momentum remains, pressure at higher levels is becoming apparent, and the space for chasing gains has narrowed compared to the early stage of the rebound.
From the comments, market sentiment appears generally optimistic, with a clear majority of investors leaning towards expecting further upside continuation. Many are focusing on levels such as HKD 140, HKD 143, HKD 150, or even higher. Some investors who have recovered their losses are choosing to hold on, reflecting a noticeable improvement in market confidence. However, amidst the optimism, signs of divergence at higher levels are starting to emerge, with some investors beginning to consider reducing positions or taking profits. There is also attention on selling pressure at HKD 136, late-day selling pressure after 3 p.m., and resistance above HKD 140, suggesting that the market is not uniformly euphoric but has entered a phase of high-level volatility following a strong rebound.
Common market questions are mainly focused on a few directions: whether tomorrow will see a pullback or continued rise, whether the HKD 136.57 level can be broken, whether resistance above HKD 140 is too strong, whether one should take partial profits at current levels, and whether there's potential to challenge HKD 150 in the longer term. These questions reflect one core issue: whether this round of rebound has enough momentum to evolve from a recovery phase into a more complete upward trend structure.
From a technical perspective, HKD 127.52 is the short-term inflection point. As long as it holds steady, the strong rebound pattern can continue. The immediate key resistance is at HKD 136.57, and if broken through and stabilized, the stock price could further test HKD 146.698. However, before breaking through, the current price is already near the upper Bollinger Band, and the relative strength index is at relatively high levels, indicating strong momentum but risk-reward attractiveness has shifted to neutral. If the resistance cannot be broken afterward or if it falls back below HKD 127.52, it will be necessary to watch for slowing rebound momentum, with the stock potentially testing support at HKD 125.655. At this stage, deployment strategies should focus on waiting for breakout confirmation or observing after a pullback rather than blindly chasing highs ahead of resistance.
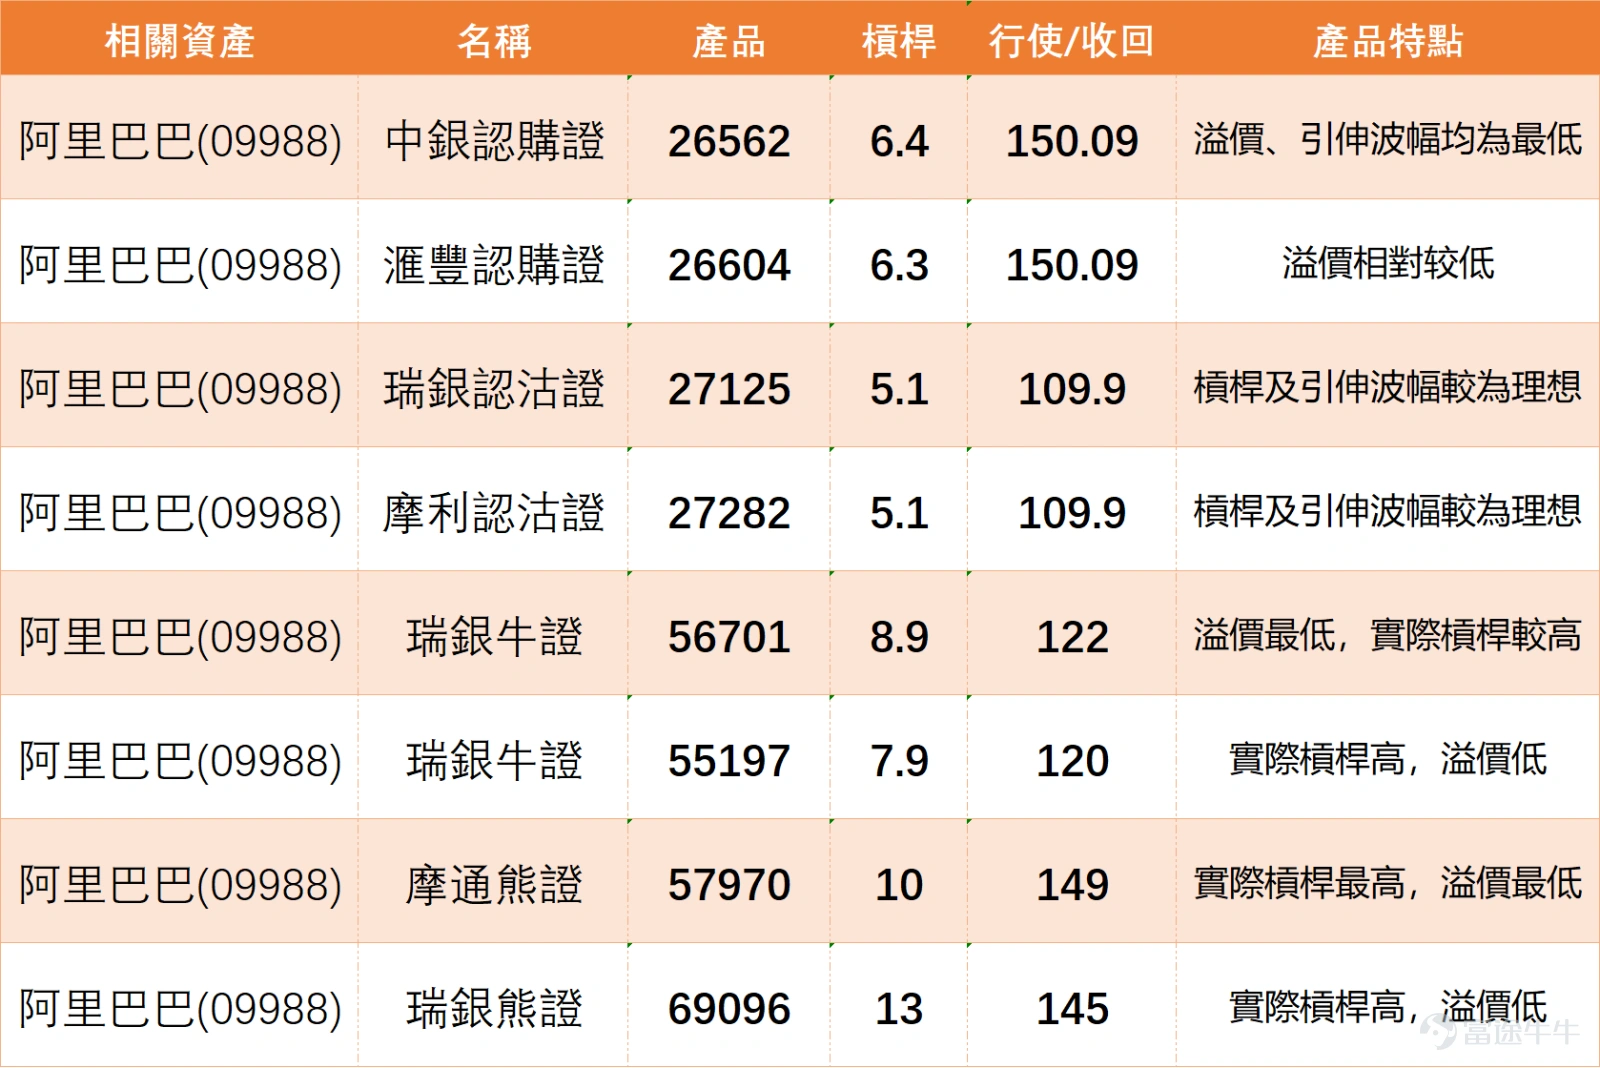
For call warrants, one option to consider is $BIALIBA@EC2608E.C (26562.HK)$ , with a strike price of 150.09 yuan, offering approximately 6.4 times leverage. The key feature of this product is its premium and implied volatility are the lowest among similar products, making it suitable for investors who are bullish on the market outlook and wish to deploy at a lower cost. Another option is $HSALIBA@EC2608F.C (26604.HK)$ , also with a strike price of 150.09 yuan, providing around 6.3 times leverage. Its premium is relatively low as well, which helps mitigate the impact of time decay.
If you are bearish on Alibaba's short-term performance, you may consider put warrant products. $UBALIBA@EP2609C.P (27125.HK)$ , with a strike price of 109.9 yuan, offering about 5.1 times leverage. Its implied volatility and leverage levels are quite ideal, effectively capturing opportunities from potential stock price declines. A similar choice would be $MSALIBA@EP2609B.P (27282.HK)$ , also with a strike price of 109.9 yuan, offering approximately 5.1 times leverage, featuring similarly attractive leverage and implied volatility structures.
For investors optimistic about the market outlook and seeking high leverage effects, bull contracts can be considered. $UB#ALIBARC26094.C (56701.HK)$ , with a stop-loss level at 122 yuan, offering around 8.9 times effective leverage. It has the lowest premium in its category and higher actual leverage. Another option is $UB#ALIBARC26091.C (55197.HK)$ , with a stop-loss level at 120 yuan, providing approximately 7.9 times effective leverage. It also boasts high effective leverage and low premium, amplifying positive returns efficiently.
As for investors who are bearish on the market outlook and want to operate with high leverage, bear contracts are an appropriate choice. $JP#ALIBARP2809J.P (57970.HK)$ , with a recovery price of 149 yuan, an actual leverage of about 10 times, making it the product with the highest actual leverage in this recommendation, and also the one with the lowest premium.$UB#ALIBARP2810G.P (69096.HK)$ , with a recovery price of 145 yuan, an actual leverage of approximately 13 times. It is similarly characterized by high actual leverage and low premium, suitable for capturing stock price pullback movements.
Each of the above products has its own characteristics. Investors can choose the appropriate deployment tool based on their outlook on the future market, risk tolerance, and leverage needs. Please note that all derivative products involve risks, prices can go up or down, and investors should carefully read relevant documents and understand the product features before investing.
Reply to some investors' views:
To reach 143.5 yuan directly, the premise is still to first break through 136.57 yuan, then look at the resistance zone above 140 yuan.
150 yuan is the next more aggressive target; in the short term, focus on two levels of resistance at 136.57 yuan and 146.698 yuan.
@@welldoneecDid it fall back to 120?
If 127.52 yuan is breached, the risk of testing lower support will increase, but no confirmation signal for this scenario has been seen yet.
Feel free to share your insights in the comment section. For more market analysis, stay tuned to 'HK Stock Warrants Jenny' for daily updates! $Hang Seng Index (800000.HK)$$Hang Seng TECH Index (800700.HK)$
Reminder: This article does not constitute any investment advice.
This article is for reference only and does not constitute any investment advice. The market data, opinions, and analysis contained herein may change at any time without prior notice. We are not responsible for any loss or damage caused by reliance on the information in this article. Technical analysis only shows whether certain technical conditions are met; a comprehensive assessment of asset performance should be conducted using additional data. Decisions to trade should not be based solely on this article. Please note that past performance is not indicative of future results.
#HKStocks #RealTimeAnalysis #WarrantPick #WarrantGuide #DerivativesHedging #HKWarrantsJenny #Alibaba #09988 #TechStocks #TechnicalAnalysis
Risk Disclaimer: The above content only represents the author's view. It does not represent any position or investment advice of Futu. Futu makes no representation or warranty.Read more
Comments (3)
to post a comment