
Hong Kong issues its first batch of stablecoin licenses! HSBC and Standard Chartered receive approva

Standard Chartered approaches previous high; the 200-dollar mark becomes critical as divergence between bulls and bears begins to emerge
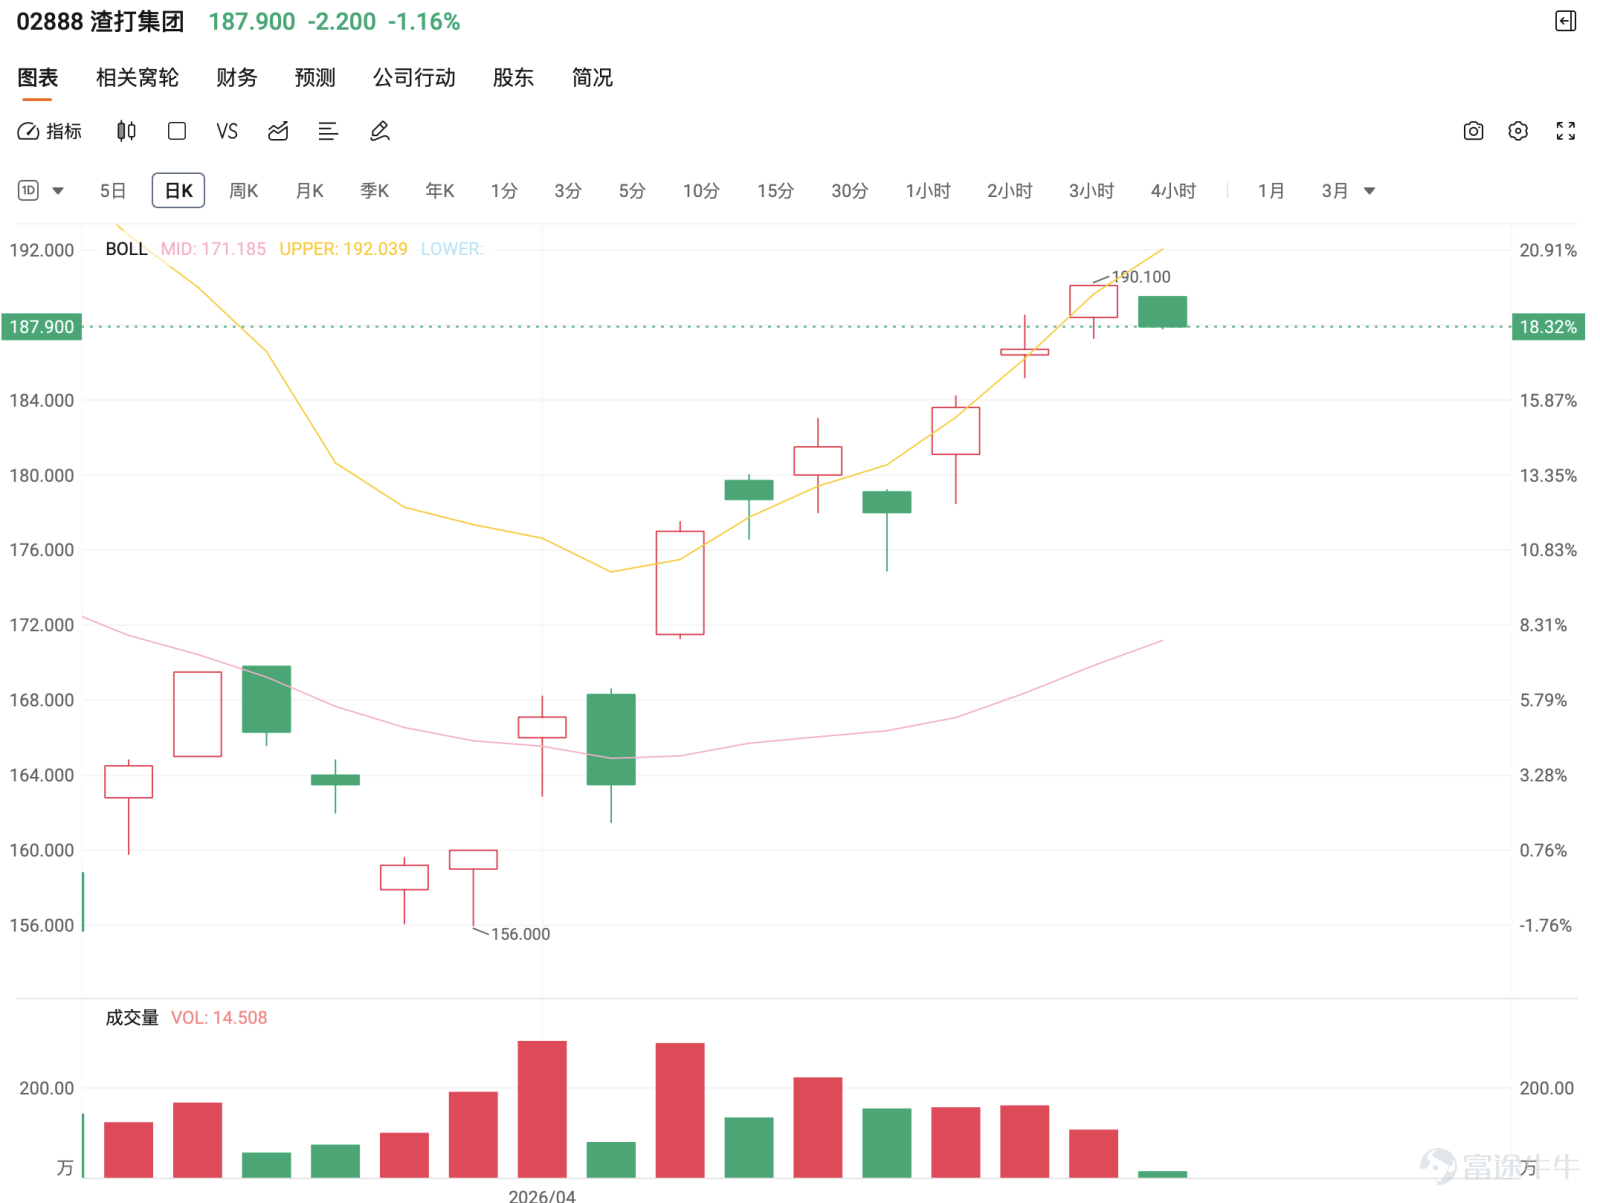
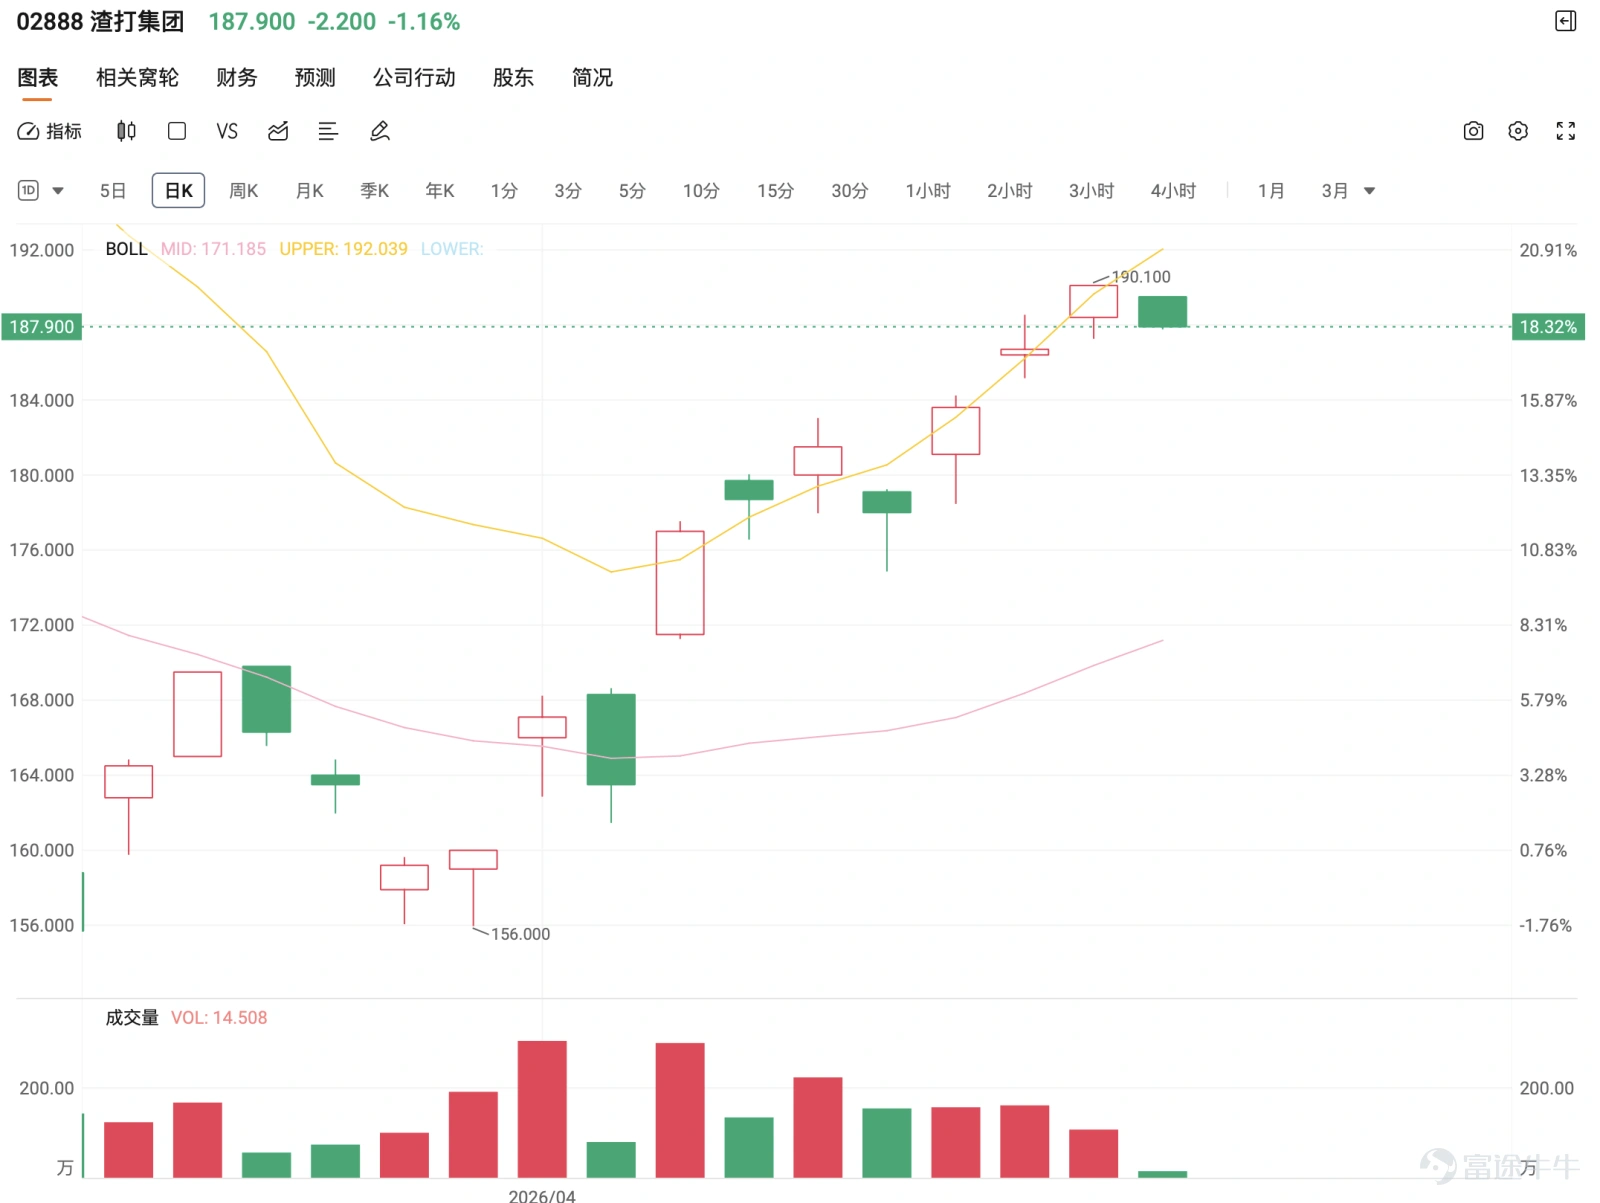
Standard Chartered Group's recent performance has shown clear signs of strengthening, with the stock price rising continuously and approaching its previous high. Market attention is gradually focusing on whether it can break through the 200-dollar mark. Comments reveal that some investors are noticeably optimistic, believing there is a chance for the stock price to extend its upward trend to 200 dollars or even set new highs. Meanwhile, other investors are considering whether it’s still a good time to buy in. However, another perspective has started to surface, including doubts about the sudden surge and concerns over the difficulty in timing the market, indicating growing divergence among market participants at these elevated levels.
Overall market sentiment leans optimistic but has shifted from unanimous bullishness to a more cautious optimism. Common questions revolve around three main areas: first, whether there is a chance to surpass 200 dollars; second, if the current price is still suitable for entering; third, whether this upward movement is sustainable.
From a technical standpoint, Standard Chartered's current price of 190.1 dollars has stabilized above multiple short- and medium-term moving averages and is closely following the upper Bollinger Band, suggesting strong short-term momentum. However, since the stock price is already near the upper band and the Relative Strength Index (RSI) is at a relatively high level, while the short-term uptrend may not be over, the room for further upward movement has begun to narrow.
The key lies in two price levels: the immediate resistance at 193.585 dollars. Once effectively broken and stabilized above, the upward trend could extend to 202.169 dollars, which is near the widely watched 200-dollar mark area. Below, 183.980 dollars serves as the watershed. As long as it holds firm, the overall structure remains biased towards a strong upward trend; however, if it breaks down, the rally might transition into consolidation at higher levels.
Overall, the current stage is in a "strong but not cheap" range, with the attractiveness of investment gradually declining from previously higher levels. The strategy leans more towards waiting for a breakout confirmation or a pullback before taking positions, rather than chasing directly at current prices.
Standard Chartered Group (02888) Warrant Product Recommendations:
183.980 yuan serves as the short-term watershed. Holding above and breaking through 193.585 yuan could see a further target at 202.169 yuan; failure to hold would indicate a slowdown in upward momentum and a return to consolidation.
Strategy One | Breakout Momentum (Preferred)
23564 $CISTANC@EC2606A.C (23564.HK)$ | Strike Price 230.88 yuan | Actual Leverage 10.3x | High leverage, suitable for chasing momentum after a breakout
23654 $BPSTANC@EC2607A.C (23654.HK)$ | Strike Price 236.88 yuan | Actual Leverage 9.0x | Mid out-of-the-money terms, offering higher flexibility for trend extension
26415 $UBSTANC@EC2610A.C (26415.HK)$ | Strike Price 229.2 yuan | Actual Leverage 5.6x | Later expiration date, suitable for retaining upside potential after a breakout
Strategy Two | Pullback Buy (More Conservative)
26415 $UBSTANC@EC2610A.C (26415.HK)$ | Strike Price 229.2 yuan | Actual Leverage 5.6x | Lower price, later expiration date, suitable for phased deployment after a pullback
27202 $CISTANC@EC2610B.C (27202.HK)$ | Strike Price 228.18 yuan | Actual Leverage 5.6x | Lower premium, balanced terms, suitable for relatively stable positioning
28216 $HSSTANC@EC2610A.C (28216.HK)$ | Strike Price 228.2 yuan | Actual Leverage 5.4x | Slightly lower actual leverage, suitable for a more conservative accumulation strategy
Reminder: This article does not constitute any investment advice.
This article is for reference only and does not constitute any investment advice. The market data, opinions, and analysis contained herein may change at any time without prior notice. We are not responsible for any loss or damage caused by reliance on the information in this article. Technical analysis only shows whether certain technical conditions are met; a comprehensive assessment of asset performance should combine other data and should not solely rely on this article to make trading decisions. Please note that past performance is not indicative of future results. Follow Jenny's insights on Hong Kong stock warrants for more professional analysis.
Risk Disclaimer: The above content only represents the author's view. It does not represent any position or investment advice of Futu. Futu makes no representation or warranty.Read more

Comments (2)
to post a comment
1