
Tencent's rise met resistance; whether the rebound strengthens will be key for future performance
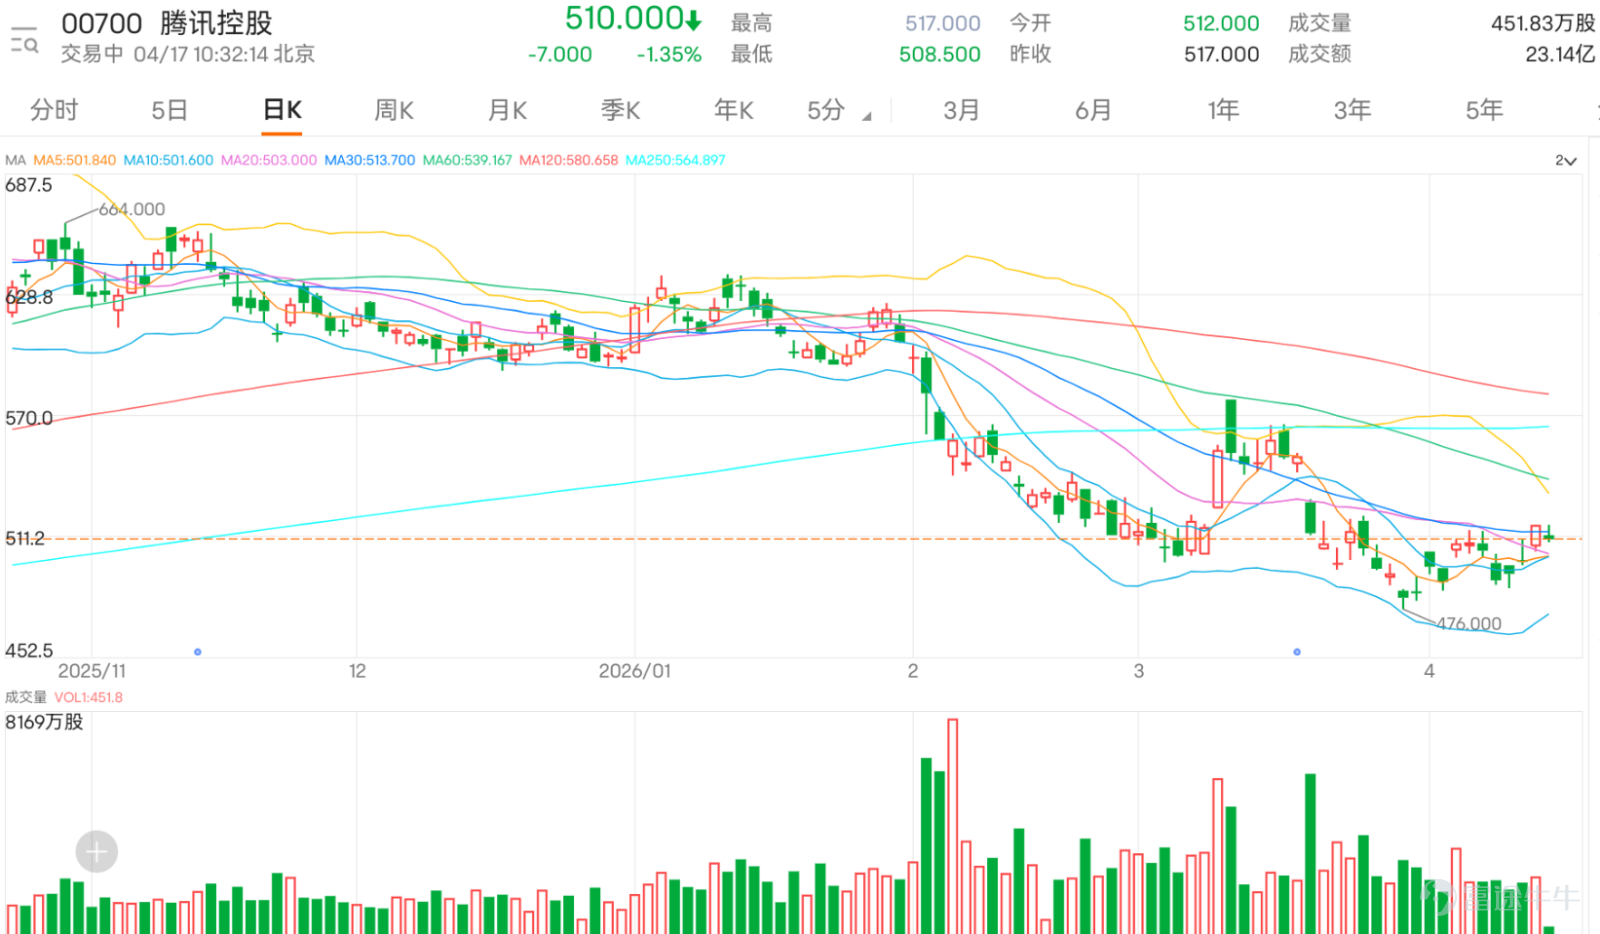
$TENCENT (00700.HK)$ Today’s trading opened high but closed lower, currently at HKD 510. The price is fluctuating between HKD 508.5 and HKD 517. The 30-day moving average (HKD 513.7) was briefly regained but then lost again. Overall, the stock remains in a rebound recovery phase and has not yet effectively broken through the upper resistance zone. The trend has not officially strengthened.
Observing market commentary, sentiment leans optimistic but with notable divergence. Many investors are beginning to anticipate a continuation of the upward trend, focusing on the range between HKD 520 and HKD 530, with some more aggressive forecasts pointing to HKD 580, reflecting confidence in an extended rebound. On the other hand, some voices note weak trading volume and significant resistance, believing the uptrend remains unstable and even predicting another pullback, indicating the market is still in a wait-and-see and testing phase.
Overall market sentiment is 'leaning optimistic but not unanimous,' reflecting the common tug-of-war between bulls and bears during a rebound. Common questions focus on several core issues: whether it can break through the HKD 520 level, whether the uptrend is sustainable, when it might reach a higher range, and whether the current price is still worth entering. These questions essentially revolve around one point: whether this rebound can evolve into a genuine strengthening trend.
From a technical perspective, HKD 507.956 is the short-term watershed. As long as this level holds, the rebound structure can be maintained. Above that, HKD 523.231 is the key resistance. Once broken and stabilized, there may be further upside potential toward HKD 540.750, indicating the trend could strengthen further. However, until the breakout occurs, the current price remains constrained by the middle axis and resistance area of the Bollinger Band channel, while the Relative Strength Index (RSI), though recovering to mid-to-high levels, does not show extremely strong momentum, leaving the risk-reward ratio neutral. If the price falls below HKD 507.956, weakening rebound momentum or even a retest of support at HKD 505 should be monitored.
Tencent (00700) has a short-term watershed at HKD 507.956. If it stabilizes and breaks through HKD 523.231, it could test HKD 540.750; if it fails to hold, watch for a retest of support at HKD 505.000.

Strategy One | Breakout Momentum (Preferred)
$HSTENCT@EC2608B.C (26394.HK)$ | Strike price HKD 629.38 | Actual leverage 11.2x | Higher actual leverage, lower implied volatility
$UBTENCT@EC2608E.C (26259.HK)$ | Strike price HKD 629.38 | Actual leverage 10.6x | Higher street volume, lower product price
$CTTENCT@EC2608C.C (26151.HK)$ | Strike price HKD 628.88 | Actual leverage 10.7x | Lower premium, lower implied volatility
Strategy Two | Pullback Buy (More Conservative)
$UBTENCT@EC2609D.C (27928.HK)$ | Strike price HKD 600.4 | Actual leverage 8.4x | Lower street volume, lower price level
$CTTENCT@EC2609A.C (27913.HK)$ | Strike price HKD 600.4 | Actual leverage 8.7x | Higher actual leverage, lower implied volatility
$HSTENCT@EC2609F.C (28217.HK)$ | Strike price HKD 600.4 | Actual leverage 8.4x | Lower premium, also at a low level
Strategy Three | Breakdown Weakens (Defensive)
$BITENCT@EP2606A.P (23122.HK)$ | Strike price HKD 499.8 | Actual leverage 9.7x | Higher actual leverage, lower product price
$UBTENCT@EP2606A.P (21984.HK)$ | Strike Price 499.8 HKD | Actual Leverage 9.2x | Implied volatility is low, open interest is low
$HSTENCT@EP2606A.P (22657.HK)$ | Strike Price 499.8 HKD | Actual Leverage 9.3x | Premium is low, also at a low level
Feel free to share your insights in the comment section. For more market analysis, please continue following ‘Hong Kong Stock Warrants Jenny’ for daily updates!
Reminder: This article does not constitute any investment advice.
This article is for reference only and does not constitute any investment advice. The market data, opinions, and analysis contained herein may change at any time without prior notice. We are not responsible for any loss or damage caused by reliance on the information in this article. Technical analysis only shows whether certain technical conditions are met; a comprehensive assessment of asset performance should be conducted using additional data. Decisions to trade should not be based solely on this article. Please note that past performance is not indicative of future results.
#HongKongStocks #LiveAnalysis #WarrantPicks #WarrantStrategy #DerivativesHedging #HKWarrantsJenny #Tencent #00700 #TechStocks #TechnicalAnalysis $Hang Seng Index (800000.HK)$$Hang Seng TECH Index (800700.HK)$
Risk Disclaimer: The above content only represents the author's view. It does not represent any position or investment advice of Futu. Futu makes no representation or warranty.Read more
Comments (3)
to post a comment