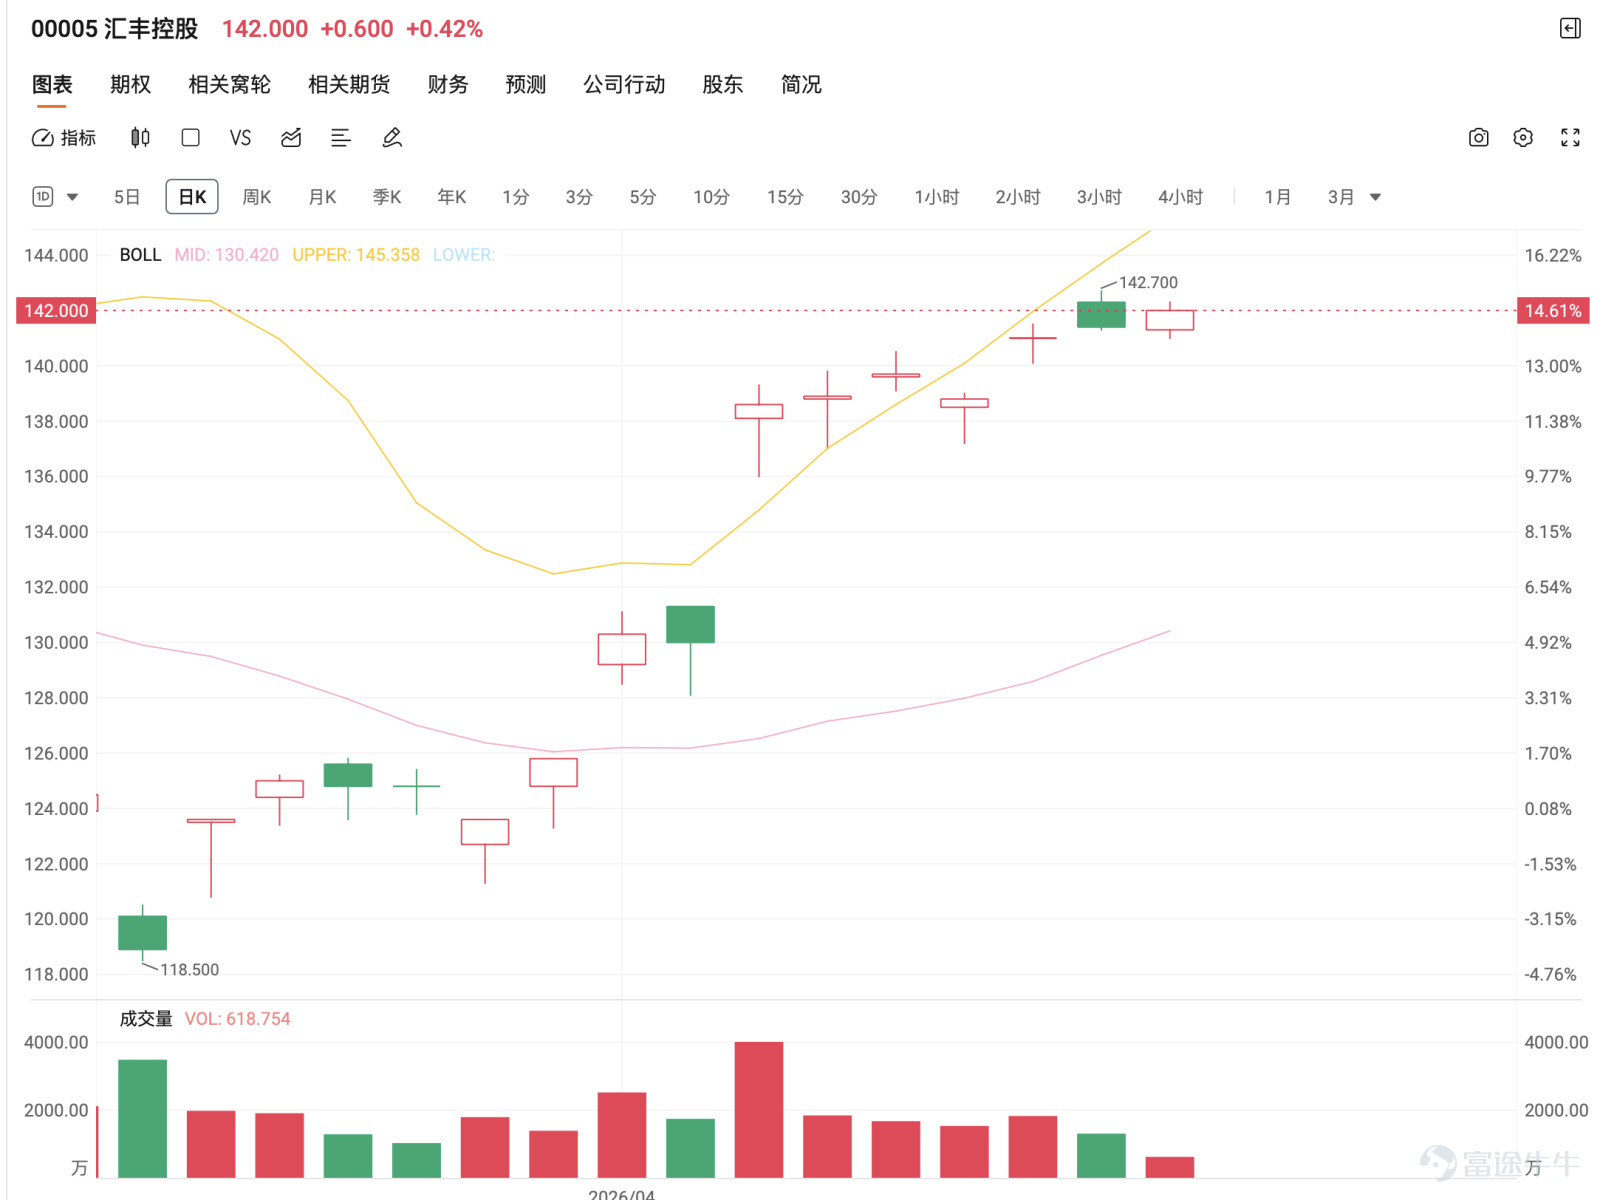

HSBC Holdings is consolidating near the previous peak, with 142.70 HKD as the key breakout level; short-term chasing at high prices is not recommended.
HSBC Holdings is currently trading at 142 yuan. After rebounding from a low, the stock price has returned to a high-level area and entered a strong consolidation pattern. The recent trend indicates a horizontal movement at highs before retesting the top. The short-term sentiment remains strong, but it is also approaching the previous high resistance level of 144.40 yuan. Additionally, the relative strength index is at a relatively high level, indicating that the short-term situation is starting to show slight overheating, and the attractiveness of betting is gradually declining.

Many investors are concerned about whether they can chase in, such as @Collecting dividends for financial freedom and retirement、@Top-picking Master@摸頂大師The current price is indeed at a relatively high position. If it doesn't break through 142.70 yuan, chasing at a high level carries significant risk. If it fails to break through and falls back, the stock price may retreat to 139.00 yuan or even lower. Therefore, a more ideal strategy would be to wait for confirmation of a breakout or a pullback before entering.
Regarding whether it will peak, such as @ForumStockFriends@論壇股友The risk of a double top is mentioned, but it has not been confirmed at this stage. Although the stock price is close to its previous high, as long as there is no clear sign of weakness (e.g., falling below 139), it still represents 'retesting the top' rather than 'having peaked.' The key lies in whether 142.70 can be effectively broken through.
Some investors are concerned about short-term rhythms, such as @,ǚ ħƋħ¶3Mentioned the strategy of selling high and buying low; the current trend is indeed suitable for range trading. If 142.70 is not broken through, one might consider reducing positions near resistance levels and redeploying near support levels, provided risk control is strictly maintained.
Regarding capital flow issues, such as @Options Graduate、@The return of the kingAsked, the current situation still shows that funds maintain certain support power, sustaining the stock price in a high-level consolidation pattern, but without significant volume breakthrough, implying upward momentum still needs further confirmation.
As for whether there will be a pullback, such as what @GoldNeedsFuel@黃金要加油、@DoraStockGodDreamShort-term pullbacks indeed present opportunities, especially when nearing the previous peak region, retreating to around 139 for consolidation again would actually be more beneficial for subsequent upside movements.
Regarding the trend patterns, such as @Flowers bloom, prosperity followsMentioning the cup-and-handle pattern, the current structure shows signs of consolidation before a potential upward move. However, whether this will materialize depends on whether it can break through $142.70 and continue its upward momentum.
In terms of short- and long-term strategies, @PC95 wins 7As mentioned, it actually depends on the purpose of holding. At this stage, short-term trading involves consolidation at high levels, which is suitable for flexible operations; for long-term holdings, you can continue to hold but should avoid significantly increasing positions at high levels.
As for ex-dividend and ex-rights, like @EndoftheWorld02@小白世界末日02, it will technically cause an adjustment in stock price, but it does not affect the actual total return, which is a normal mechanism.
Overall, HSBC Holdings is currently undergoing a strong consolidation phase before retesting the top, but the risk-reward ratio is average until the previous peak is broken. The strategy should focus on 'breakout follow-up' or 'pullback accumulation', rather than chasing at high levels.
In the warrant market:
Strategy One | Breakout Momentum (Preferred)
25899 | Strike Price $142.88 | Actual Leverage 6.7x | Close to the breakout point, suitable for following up after breaking through $142.70
26077 | Strike Price 143.88 | Actual Leverage 7.1x | Balanced terms, suitable for deployment after confirming a breakout
24208 | Strike Price 131.88 | Actual Leverage 5.9x | Higher degree of at-the-money, suitable for deployment in extended breakout scenarios
Strategy Two | Buy on pullback (Neutral)
27220 | Strike Price 138.98 | Actual Leverage 6.7x | Suitable for low accumulation near 139.00 after stabilization upon pullback
26928 | Strike Price 138.88 | Actual Leverage 6.3x | Stable terms, suitable for low accumulation following the trend
24208 | Strike Price 131.88 | Actual Leverage 5.9x | Relatively conservative allocation, suitable for targeting rebound above 142
Strategy Three | Defensive Pivot on Weakness
25460 | Strike Price 126.56 | Actual Leverage 9.2x | Suitable for defensive deployment after breaking below 139.00
26486 | Strike Price 125.98 | Actual Leverage 6.7x | Balanced terms, suitable for tracking weakening trends
28117 | Strike Price 122.78 | Actual Leverage 6.7x | More conservative allocation, suitable for deployment during continued weakness
Reminder: This article does not constitute any investment advice.
This article is for reference only and does not constitute any investment advice. The market data, opinions, and analysis contained herein may change at any time without prior notice. We are not responsible for any loss or damage caused by reliance on the information in this article. Technical analysis only shows whether certain technical conditions are met; a comprehensive assessment of asset performance should combine other data and should not solely rely on this article to make trading decisions. Please note that past performance is not indicative of future results. Follow Jenny's insights on Hong Kong stock warrants for more professional analysis.
Risk Disclaimer: The above content only represents the author's view. It does not represent any position or investment advice of Futu. Futu makes no representation or warranty.Read more


Comment (1)
to post a comment
6