Meituan (03690) Warrants Product Classification Recommendations: Breakout Strategy, Low Absorption Strategy, Defensive Strategy Terms Overview
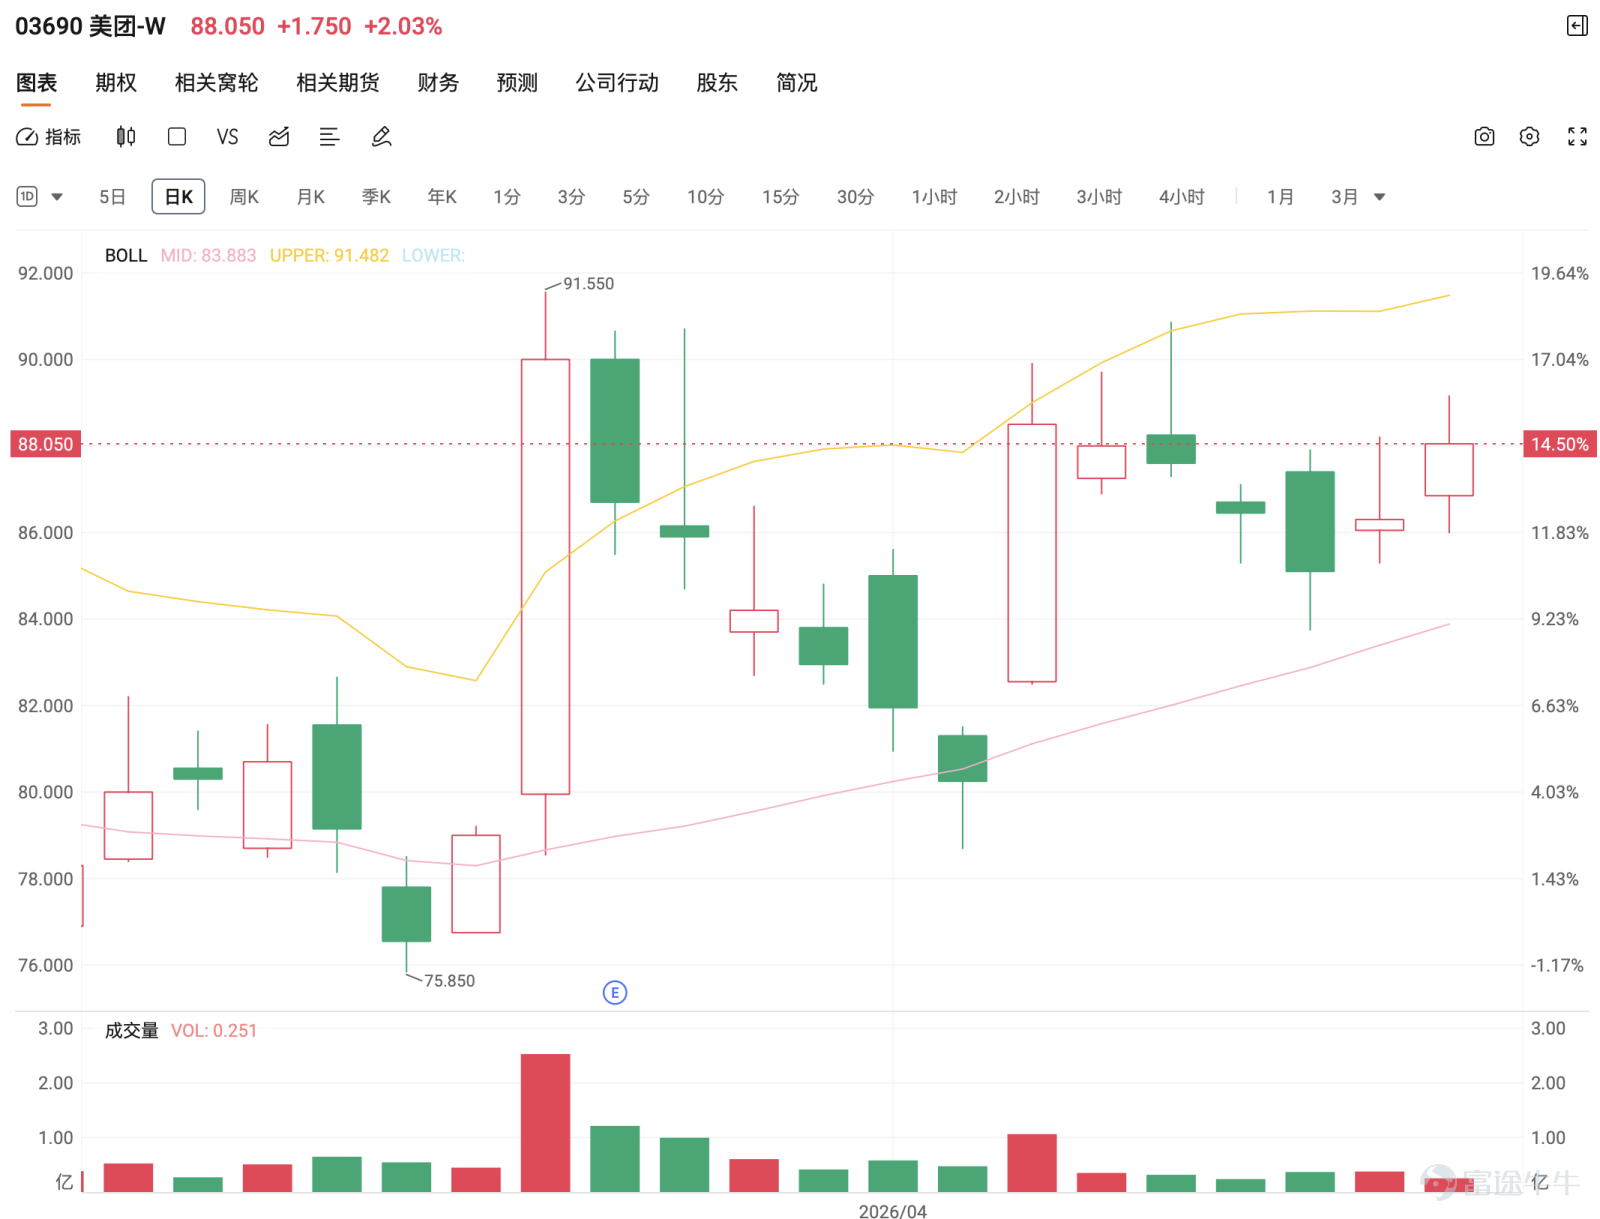
Meituan is currently trading at HKD 88.1, with its short-term trend in a consolidation phase following a rebound from the low of HKD 73. The stock has recovered somewhat from its lows and the structure has improved compared to before; however, it remains constrained by medium-term downward trend pressure and cannot extend further upward yet. The most critical short-term level remains at HKD 88.80, and until it breaks through this point, the overall situation should still be considered a tug-of-war within recovery rather than having completed a turnaround.
Technically, the first support level is at 83.80 yuan, followed by 80.50 yuan; the resistance above is initially at 88.80 yuan, and then 92.50 yuan. This means that the current price is in the middle of the range, with both upward and downward potential, but neither side has a clear advantage. If the stock price can break through 88.80 yuan and stabilize, there may be an opportunity to upgrade the recovery trend and test 92.50 yuan; conversely, if it falls below 83.80 yuan, it would indicate that this round of rebound could end, and at that time, one should be cautious about a retest of 80.50 yuan.

To @Zeming@澤銘、@gƖƋħǾųƋśņŔǏ、@Don't stay green and inactiveRegarding @Zeming's mention of 'high opening, low closing,' this is actually the most typical characteristic of the current market. When the stock price approaches the resistance zone but fails to break through, it often results in an early surge followed by a pullback, reflecting insufficient buying interest. This does not necessarily mean weakening, but it shows that the market is still in a tug-of-war, rather than a one-sided uptrend.
@StubbornBronzeGamer noticed frequent upper shadows, which is an important observation. The frequent appearance of upper shadows usually indicates continuous selling pressure at higher levels, corresponding to the resistance near 88.80 yuan. Therefore, before a breakout, it’s indeed difficult for a sustained upward movement in the short term.
However, on the other hand, @Autumn in the mountains. Wealth flows in from all directions.Pointed out that it hasn’t fallen, @AnotherTradeA similar situation has also appeared in other stocks, which actually reflects that the underlying support is not weak. The stock price being able to repeatedly stabilize within the range of 83 to 86 yuan indicates that the market is not completely bearish. This state of 'unable to fall but also unable to break through upward' is exactly the most typical manifestation of a range-bound market.
For questions related to fundamentals, @Flame, flame, torch, torch, dazzling light, flame, flame.Mentioned that the impact of food delivery regulation affects sentiment, @Radiant, vibrant, dazzling, brilliant, glowing, luminous.Focus on commission and loss issues, while @Philip of Perseverance@毅力的菲利普Asked whether the platform's competitive advantage still exists. These factors indeed affect medium-term valuation and fund positioning, but the short-term trend already directly reflects market sentiment — that is, willingness to take positions, but reluctance to aggressively chase prices at current levels. Therefore, regardless of how fundamentals are interpreted, the short term still depends on whether the price breaks through key levels.
@Buying at the Peak@Buy at the Peak Sell at the Bottom asked about the outlook after forcefully recovering the moving average. This can be understood as an initial signal of stabilization, but not yet a sign of strength. Because the true hallmark of turning strong isn't just staying above the moving average, but whether it can break through and firmly hold above the resistance zone, i.e., 88.80 yuan. Until this step is achieved, it remains a recovery process.
@Crossing Yin and Yang Journey@跨越陰陽行As for whether there is still room for upside in a weak market, the answer is 'yes, but limited.' This is because individual stocks have rebounded from their lows, but remain pressured from above. Therefore, unless the broader market cooperates or they break through resistance on their own, short-term upside will be constrained.
Regarding timing and operation, @炥炦炥炩炤炦炣炥炨 asked if entering the market at the end of the trading day carries risks. This type of question is hardest to handle when in the middle range of an interval since it’s neither a low point nor has it broken through resistance, making the risk-reward ratio less attractive. In contrast, @香格里拉AA asked how to enter the market during volatile conditions. A more reasonable approach would be to wait for a retest and stabilization at support (e.g., 83.80 yuan) or to follow after breaking through 88.80 yuan, rather than frequently trading in the middle position.
Market sentiment also shows clear divergence. @Miao miao miao miao water、@Boat Lamp King、@I’m a newbieShowing typical pressure of holding weak stocks, where the trend feels indecisive or even lacks elasticity; on the other hand, @阿玉還想吃 asks if the worst phase has passed, @Bronze ApprenticeWondering if the market can rise again by the end of the month. This divergence itself indicates that the market hasn’t formed a unified direction, further confirming the current sideways tug-of-war pattern.
@A big bull market with bearish alignmentThe question of whether a death cross in the moving averages indicates a significant drop needs to be analyzed separately. A single death cross does not necessarily mean an immediate sharp decline, but if it coincides with a break below the support level at 83.80 yuan, the technical significance will increase significantly. Similarly, @Hong Le BuWhen discussing whether the gap should be filled, this kind of technical action is usually more meaningful after breaking through the support.
@A torch of fire, a flame of passion, a blaze of enthusiasm.、@Bubble Bubble Nio has a futureAs for whether there is major control or distribution, it is difficult to directly judge in a range-bound market. A more practical approach is still to observe the price: if it continuously fails to break through resistance and eventually loses support, then it would reflect more of a distribution or weakening technical pattern.
Overall, Meituan is still in a consolidation pattern after a rebound, and before breaking through 88.80 yuan, excessive optimism is not advisable. There are three clear short-term strategies. First, if it breaks through 88.80 yuan and stabilizes, it's a better signal to go long, with a target of 92.50 yuan. Second, if it pulls back to stabilize near 83.80 yuan, then it can be used as a low absorption point within the range, with a target of bouncing back to 88 yuan. Third, if it breaks below 83.80 yuan, it means the rebound may fail, and at that time, a retest of 80.50 yuan should be guarded against.
Warrant product recommendation:
Strategy One | Breakout Trend Following (Preferred)
26464 | Strike price 90.05 yuan | Actual leverage 5.6 times | Close to the breakout point, suitable for following up after breaking above 88.80 yuan
26182 | Strike Price 90.00 yuan | Actual Leverage 5.1x | Balanced terms, suitable for deployment after confirming a strengthening trend
26740 | Strike Price 88.93 yuan | Actual Leverage 2.7x | More conservative allocation, suitable for steady trend-following after a breakout
Strategy Two | Buy on retracement (Neutral)
28039 | Strike Price 86.95 yuan | Actual Leverage 3.8x | Suitable for low吸deployment after a pullback and stabilization
27137 | Strike Price 83.43 yuan | Actual Leverage 3.8x | Close to the retracement zone, suitable for buying near 83.80 yuan
27505 | Strike Price 83.43 yuan | Actual Leverage 3.7x | Stable terms, suitable for range-bound rebound deployment
Strategy Three | Defensive Pivot on Weakness
21519 | Strike Price 82.83 yuan | Actual Leverage 5.6x | Suitable for defensive deployment after breaking below 83.80 yuan
20793 | Strike Price 82.88 yuan | Actual Leverage 6.0x | Higher leverage, suitable for following weakening trends
21291 | Strike Price 82.83 yuan | Actual Leverage 5.7x | Balanced terms, suitable for deploying during prolonged weakness
Reminder: This article does not constitute any investment advice.
This article is for reference only and does not constitute any investment advice. The market data, opinions, and analysis contained herein may change at any time without prior notice. We are not responsible for any loss or damage caused by reliance on the information in this article. Technical analysis only shows whether certain technical conditions are met; a comprehensive assessment of asset performance should combine other data and should not solely rely on this article to make trading decisions. Please note that past performance is not indicative of future results. Follow Jenny's insights on Hong Kong stock warrants for more professional analysis.
Risk Disclaimer: The above content only represents the author's view. It does not represent any position or investment advice of Futu. Futu makes no representation or warranty.Read more

Comment (1)
to post a comment
3