Xiaomi remains in a weak consolidation phase; before reclaiming the range of 31.30 to 31.70 yuan, any rebound should only be considered a technical correction.
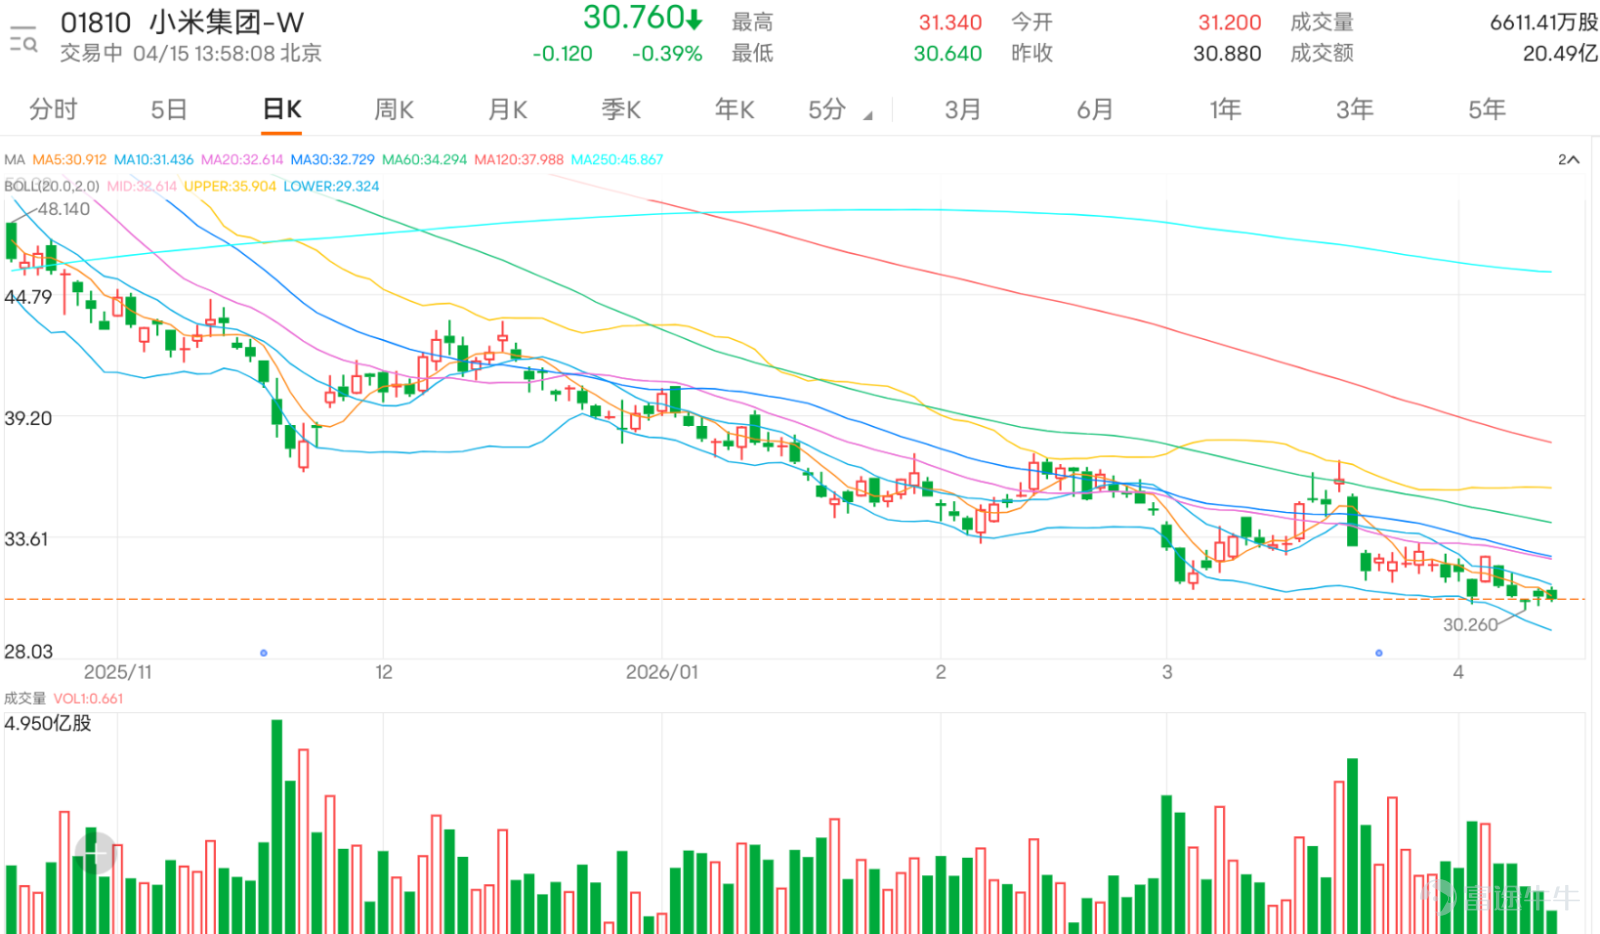
$XIAOMI-W (01810.HK)$ Currently trading at 30.76 yuan, down 0.39%. Xiaomi's share price had previously rebounded to 37.50 yuan but then retreated again, recently testing as low as 30.26 yuan, reflecting that the overall structure has not yet escaped the pressure of lower lows. In the recent period, the stock price has been fluctuating between 30 and 31.3 yuan. From a technical perspective, this phase is more appropriately characterized as a weak consolidation following a mid-term pullback, rather than a confirmed reversal into an upward trend.
Looking at the moving average system, Xiaomi’s current price is still below the 5-day line at 31.31 yuan, the 10-day line at 31.66 yuan, the 20-day line at 32.74 yuan, the 30-day line at 32.87 yuan, the 60-day line at 34.42 yuan, and the 120-day line at 38.14 yuan, indicating that both short- and medium-term structures remain weak. In other words, even if there is a rebound now, it should temporarily be viewed as a technical recovery after stabilizing at lower levels, rather than a genuine resumption of an upward trend. Regarding resistance above, the short-term focus is on the 31.30 to 31.70 yuan range, near the 5-day and 10-day lines. If the price moves higher, attention should be paid to the 32.70 to 32.90 yuan range because it is close to both the 20-day and 30-day lines, forming a key short-term resistance zone for rebounds.
In terms of the Bollinger Bands, the middle band is at 32.74 yuan, the upper band at 35.93 yuan, and the lower band at 29.55 yuan. The current price remains below the middle band and is running close to the lower band, indicating that the overall situation is still relatively weak, though the momentum for further sharp declines has temporarily slowed. This kind of movement typically reflects that the stock price has entered a phase of low-level fluctuations rather than completed a reversal. If the price can break back above the 31.30 to 31.70 yuan range and gradually approach the middle band, the technical rebound may expand. Conversely, if it falls again toward or even breaks below 30.26 yuan, the weak pattern will become even more evident.
In terms of momentum, the RSI is around 38.3, which is in a relatively weak region—not extremely oversold but also showing no clear signs of strengthening, reflecting insufficient buying confidence. In terms of trading volume, despite the recent pullback, activity remains relatively high, indicating that there is some underlying support at lower levels, with some short-term speculative funds attempting to bet on a rebound. However, without sustained breakout volume, this suggests that the market is still largely in wait-and-see mode with short-term speculation rather than turning optimistic about the mid-term trend.

Market commentary actually provides a good reflection of Xiaomi's current sentiment.@射穿大氣層 The view that a rebound is imminent, as mentioned by @隱患隱隱隱行 regarding a potential pullback divergence and short-term rebound conditions, is not entirely baseless since the stock price is currently close to its low range. Moreover, technical rebounds often occur near the lower rail. @月球人 hopes the stock can climb back above 31 yuan, which aligns with the first resistance level for the current rebound on the chart. However, technically, the crucial factor isn't just whether it rebounds but whether it can stabilize above 31.30 to 31.70 yuan afterward; otherwise, the rebound might only be a brief rise.
On the other hand, there are also many conservative or even bearish voices. @@卡斯娜 reminds not to catch falling knives, while @@Forever Go suggests waiting until the downward trend has completely reversed, which is quite in line with the current structure. @烏龍高到 mentioned that 30 yuan could drag on for several months, highlighting market concerns that even if Xiaomi's stock temporarily stabilizes, it may not quickly enter a clear upward trend but instead seesaws at the bottom. @@西方石油小韭菜, @Delvik, @232598070 reflect growing investor distrust in each subsequent pullback after a rally.
As for the share repurchase factor, @@ZHU BING, @26431796, @停少..., @羽少人文, @@卖飞哥zzz all focus on whether the buybacks are sufficient to support the stock price. This represents another key market contradiction: while corporate actions might provide some support, from a technical perspective, buybacks have yet to push the stock above major moving averages, so sentiment won’t fully improve based on a single positive factor alone. @先回本再翻倍 questioned whether 30 yuan will hold as a floor, a critical concern for many investors, since around 30.26 yuan is an important short-term support. If this level breaks, confidence in holding 30 yuan will significantly drop.
From a short-term trading perspective, Xiaomi’s immediate target is around 31.70 yuan, with a stop-loss near 30.20 yuan, offering an estimated upside of about 2.66% and downside risk of approximately 2.20%, resulting in a reward-to-risk ratio of about 1.21. This implies there is some room for technical recovery, provided the 30.26 yuan support holds. As long as this level remains intact, the stock can be considered consolidating at lows, with potential to test resistance between 31.30 and 31.70 yuan. However, given the overall structure is still constrained by multiple short- to medium-term moving averages, any rebound should be viewed as a technical correction rather than a fundamental strengthening.
In summary, Xiaomi is likely attempting a short-term rebound within a weak consolidation phase. The 30.26 yuan level is the most critical short-term support; if it holds, rebound hopes remain alive. However, before surpassing 31.30 to 31.70 yuan, the overall picture should still be seen as a technical repair rather than a definitive trend reversal. A genuine breakout above 31.70 yuan, followed by movement toward 32.70 to 32.90 yuan, could expand the rebound. Conversely, breaking below 30.26 yuan would signal caution against further downside exploration after weak consolidation.

Reminder: This article does not constitute any investment advice.
This article is for reference only and does not constitute any investment advice. The market data, opinions, and analysis contained herein may change at any time without prior notice. We are not responsible for any loss or damage caused by reliance on the information in this article. Technical analysis only shows whether certain technical conditions are met; a comprehensive assessment of asset performance should be conducted using additional data. Decisions to trade should not be based solely on this article. Please note that past performance is not indicative of future results.
#Hong Kong Stocks #Real-time Analysis #Warrants Selection #Warrants Strategy #Derivatives Hedging #Hong Kong Stocks Warrants Jenny #Xiaomi #01810 #Tech Stocks #Technical Analysis $Hang Seng Index (800000.HK)$$Hang Seng TECH Index (800700.HK)$
Risk Disclaimer: The above content only represents the author's view. It does not represent any position or investment advice of Futu. Futu makes no representation or warranty.Read more

Comments
to post a comment
2