Ganfeng Lithium remains strong after the breakout, and as long as it holds above 79 yuan, it is still expected to test the range of 83.5 yuan to 85 yuan.
Looking at the overall lithium battery and new energy vehicle sectors, the market showed a divergent trend on the previous day (April 14). $GANFENGLITHIUM (01772.HK)$
It surged strongly against the market trend, while other major peers such as $CATL (03750.HK)$ dropped 3.30% to 660.0 yuan, $BYD COMPANY (01211.HK)$ slightly fell 0.82% to 109.4 yuan, $TIANNENG POWER (00819.HK)$ fell 1.48% to 7.99 yuan. From a technical perspective, although the share prices of the aforementioned peers are still above several major moving averages, maintaining a bullish arrangement, their Relative Strength Index (RSI) has entered the high range of 58 to 74, indicating that the sector as a whole is in an overbought state in the short term. In particular, BYD (RSI 63) and Tian Neng Power (RSI 68) have clearly entered the overbought zone, and CATL (RSI 58) is also approaching the upper limit. On the same day, multiple technical systems issued 'sell' signals for these stocks, suggesting short-term adjustment pressure. This highlights Ganfeng Lithium's independent strength amidst widespread profit-taking pressures in the sector, but also requires attention to potential linked volatility risks following the sector's overall surge.
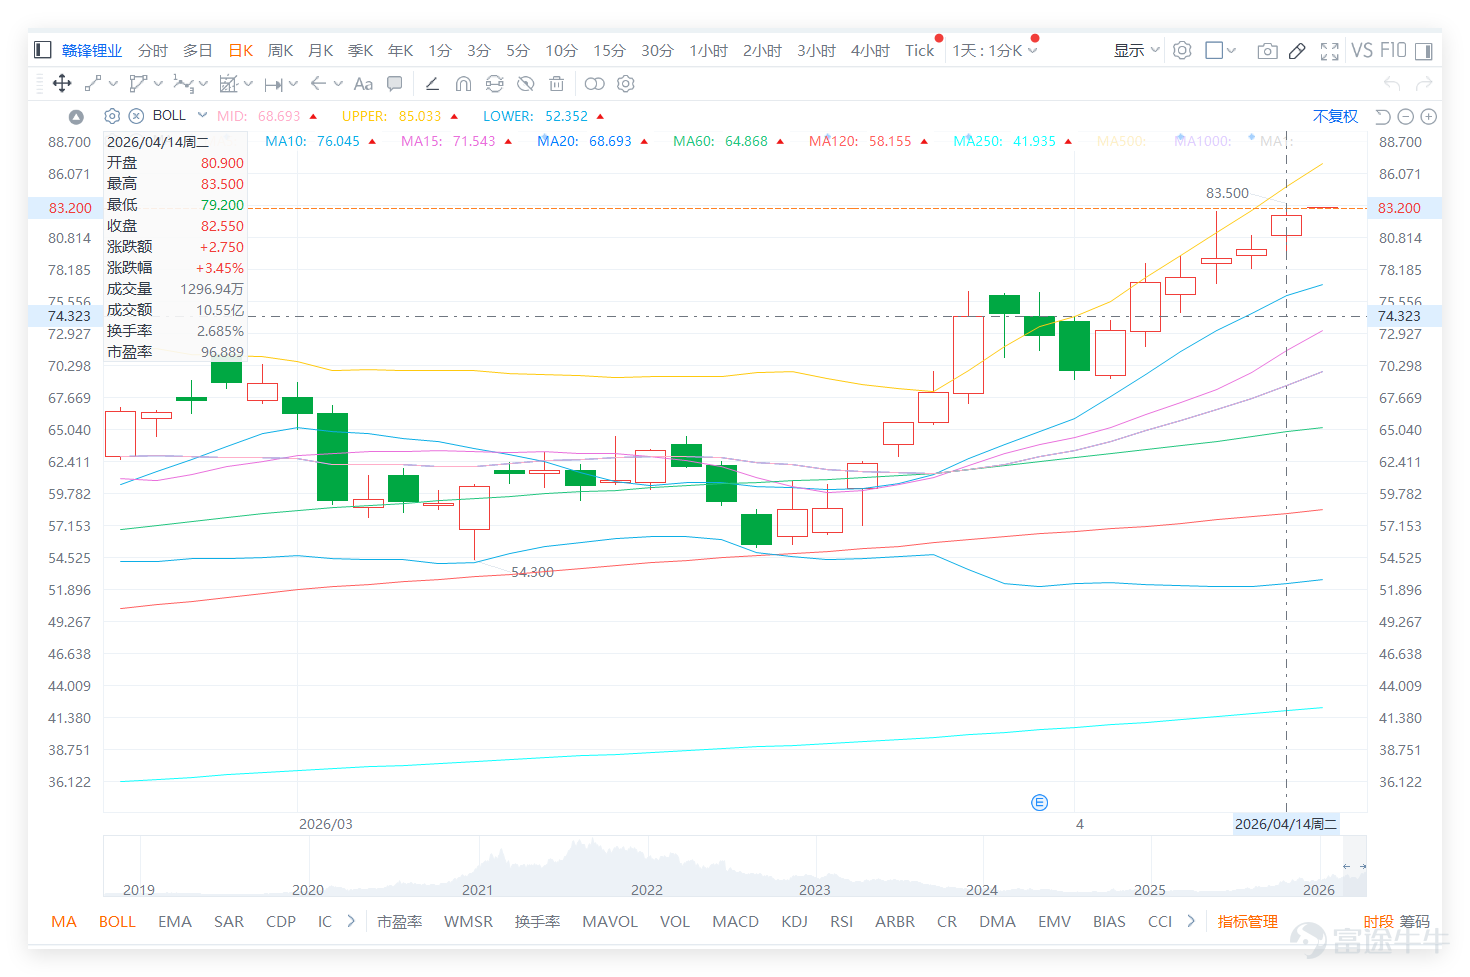
Ganfeng Lithium closed at 82.55 yuan on April 14, up 3.45% for the day. From an overall trend perspective, the stock price had previously fallen to around 53.20 yuan, then gradually stabilized. After a period of consolidation, it recently showed clear upward momentum, breaking through multiple medium- and short-term moving averages, and has now surged to a high of 83.50 yuan. Although the current price is not at the daily high, it remains close to the upper range, reflecting that the uptrend has not weakened significantly. At this stage, the trend appears more like a continuation after a breakout rather than a simple rebound from a low position.

From the moving average system, Ganfeng Lithium's current price is firmly above the 5-day line at 79.18 yuan, the 10-day line at 76.05 yuan, the 20-day line at 68.69 yuan, the 30-day line at 66.31 yuan, the 60-day line at 64.87 yuan, and the 120-day line at 58.16 yuan, forming a very clear bullish alignment. This indicates that the short-, medium-, and long-term moving averages are all trending upwards, with market dominance still clearly favoring the bulls. However, there is already a certain deviation between the stock price and the medium- and short-term moving averages, meaning the short-term cumulative gains have been significant. Therefore, although the trend remains strong at this stage, it is also starting to enter a zone where consolidation could occur at any time. In other words, the trend itself is still healthy, but the risk-reward ratio is no longer as attractive as when it started from lower levels.
Regarding the Bollinger Bands, the middle band is around 68.69 yuan, the upper band is approximately 85.03 yuan, and the lower band is around 52.35 yuan. The current price of 82.55 yuan is clearly in the upper half of the channel and very close to the upper band, reflecting that the stock is still in a strong upward phase. When the stock price moves quickly along the upper half of the Bollinger Bands, it usually indicates that market funds have a significant willingness to chase higher prices, with trend momentum being quite pronounced. However, since the current price is not far from the upper band, while there is still potential to challenge higher levels in the short term, it is also beginning to enter an overheated region. If subsequent trading volumes do not increase correspondingly, consolidation near 83.5 yuan to 85 yuan may first occur.
In terms of momentum, the short-term RSI is around 84.3, while the mid-term RSI is approximately 75.1 and 66.9, which is a fairly high level. This indicates that the stock price is currently in a strong but overheated state. This is typically not an immediate signal of weakness but rather represents a strong trend; however, the risk-reward ratio for entering new positions at this point has decreased, making sideways movement, fluctuations, or even temporary pullbacks likely to digest gains. Regarding trading volume, about 12.98 million shares were traded on the previous day (April 14), with overall activity remaining robust. Reviewing recent volume bars, noticeable trading volume support emerged during the acceleration of the uptrend, showing that this rise was not purely a volume-less surge but was driven by actual capital inflows. This is positive for assessing the overall trend, but if new highs are reached without corresponding increases in trading volume, one should watch whether the uptrend begins transitioning from rapid ascent to digestion at higher levels.
Market chatter reflects the two main sentiments at present. On one side are those who remain bullish, such as @HSI is scam, who believe that the stock has broken through 80 yuan and is targeting 85 yuan, a judgment that aligns closely with technical analysis since 83.5 yuan to 85 yuan is indeed the most immediate short-term target area. @233871802 mentioned aiming for 82 yuan first and reassessing later, which is also a practical view because, for a strong stock, progressively reclaiming round numbers and higher areas is inherently the healthiest path. @股海小漁兒The view that the trend is stable also aligns with the current chart, as despite the overheated conditions, there are no obvious signs of loss of control or weakening.
On the other hand, there are also many cautious voices in the market. @Yu168168 believes that after 1772’s run, it’s time to exit quickly—a sentiment stemming from the stock’s large short-term gains, naturally raising concerns about increasing profit-taking at higher levels. @迪乐 mentioned underperformance compared to Tianqi and A-shares but also expressed suspicion that unusual behavior might indicate underlying issues, reflecting the typical investor dilemma towards strong stocks at high levels: knowing the trend is strong but fearing a sudden reversal. @韭菜炒c鸡蛋 felt slightly weak, a common perception for stocks near their highs and upper bands, as any sign of deceleration prompts worries about potential consolidation.
As for discussions on news and sector-related topics, such as @234094576 asking whether lithium stocks might be affected by expectations of a rights issue,@頑固的雷納德 the mention of Zimbabwe relaxing lithium exports,@君實廢物and the hope that it will closely follow the main lithium carbonate futures contract—all these indicate that market attention on Ganfeng Lithium is not just about technical charts but also includes lithium prices, supply, and industry news. These factors will naturally influence sentiment in the short term, but judging from the current stock price performance, the market still prefers to interpret it as an ongoing strong trend rather than rushing to consider it peaking.
From a short-term deployment perspective, the first support level can be seen at HKD 80.00 to 79.20, near the round-number level and the 5-day moving average; further support lies between HKD 76.00 and 76.50, around the 10-day moving average area; if this support is broken, one would need to look back at HKD 72 to 73, or even lower towards the HKD 68.70 Bollinger Band midline. On the resistance side, the first resistance level is at HKD 83.50, which was the high of the previous day (14th); further resistance is around HKD 85.00, near the upper Bollinger Band. If there’s a solid breakout above this, the next target could aim for HKD 88 or higher. This shows that Ganfeng Lithium's current key characteristic is its strong directionality, but the price is already relatively high. From a short-term trading perspective, it would be better to wait for the stock to retest support levels near HKD 79 or 76 before entering, providing a better risk-reward ratio compared to chasing at higher levels.
In summary, Ganfeng Lithium is currently in a strong continuation trend following a breakout. The moving averages are well aligned, market momentum is highly prominent, and the overall trend clearly leans bullish. However, since the stock price has risen close to a short-term peak zone and the RSI is at a high level, the risk-reward ratio of chasing higher now is not as favorable as during the early stages of the uptrend. At this stage, a reasonable approach would be to maintain a positive outlook but avoid being overly eager to chase highs. The key focus should be on whether the stock can hold steady above HKD 79 and then break through HKD 83.50 to 85.00. Holding above support and breaking new highs would suggest the uptrend may continue; if it breaks below HKD 76, it will likely enter a more noticeable consolidation phase around the recent highs.
Based on the above analysis, the strategies for deployment can be divided into the following main approaches:

For more market analysis, stay tuned to Jenny's daily updates on 'Hong Kong Stock Warrants'!
Reminder: This article does not constitute any investment advice.
This article is for reference only and does not constitute any investment advice. The market data, opinions, and analysis contained herein may change at any time without prior notice. We are not responsible for any loss or damage caused by reliance on the information in this article. Technical analysis only shows whether certain technical conditions are met; a comprehensive assessment of asset performance should be conducted using additional data. Decisions to trade should not be based solely on this article. Please note that past performance is not indicative of future results.
#HongKongStocks #GanfengLithium #RealTimeAnalysis #WarrantPicks #WarrantStrategy #DerivativesHedging #HKStocksWarrantsJenny #BlueChipStocks #TechnicalAnalysis
Risk Disclaimer: The above content only represents the author's view. It does not represent any position or investment advice of Futu. Futu makes no representation or warranty.Read more

Comments (6)
to post a comment
2