
From dividend to breakout: HSBC approaches previous high of $144, market divided between 'chasing or waiting for a drop'
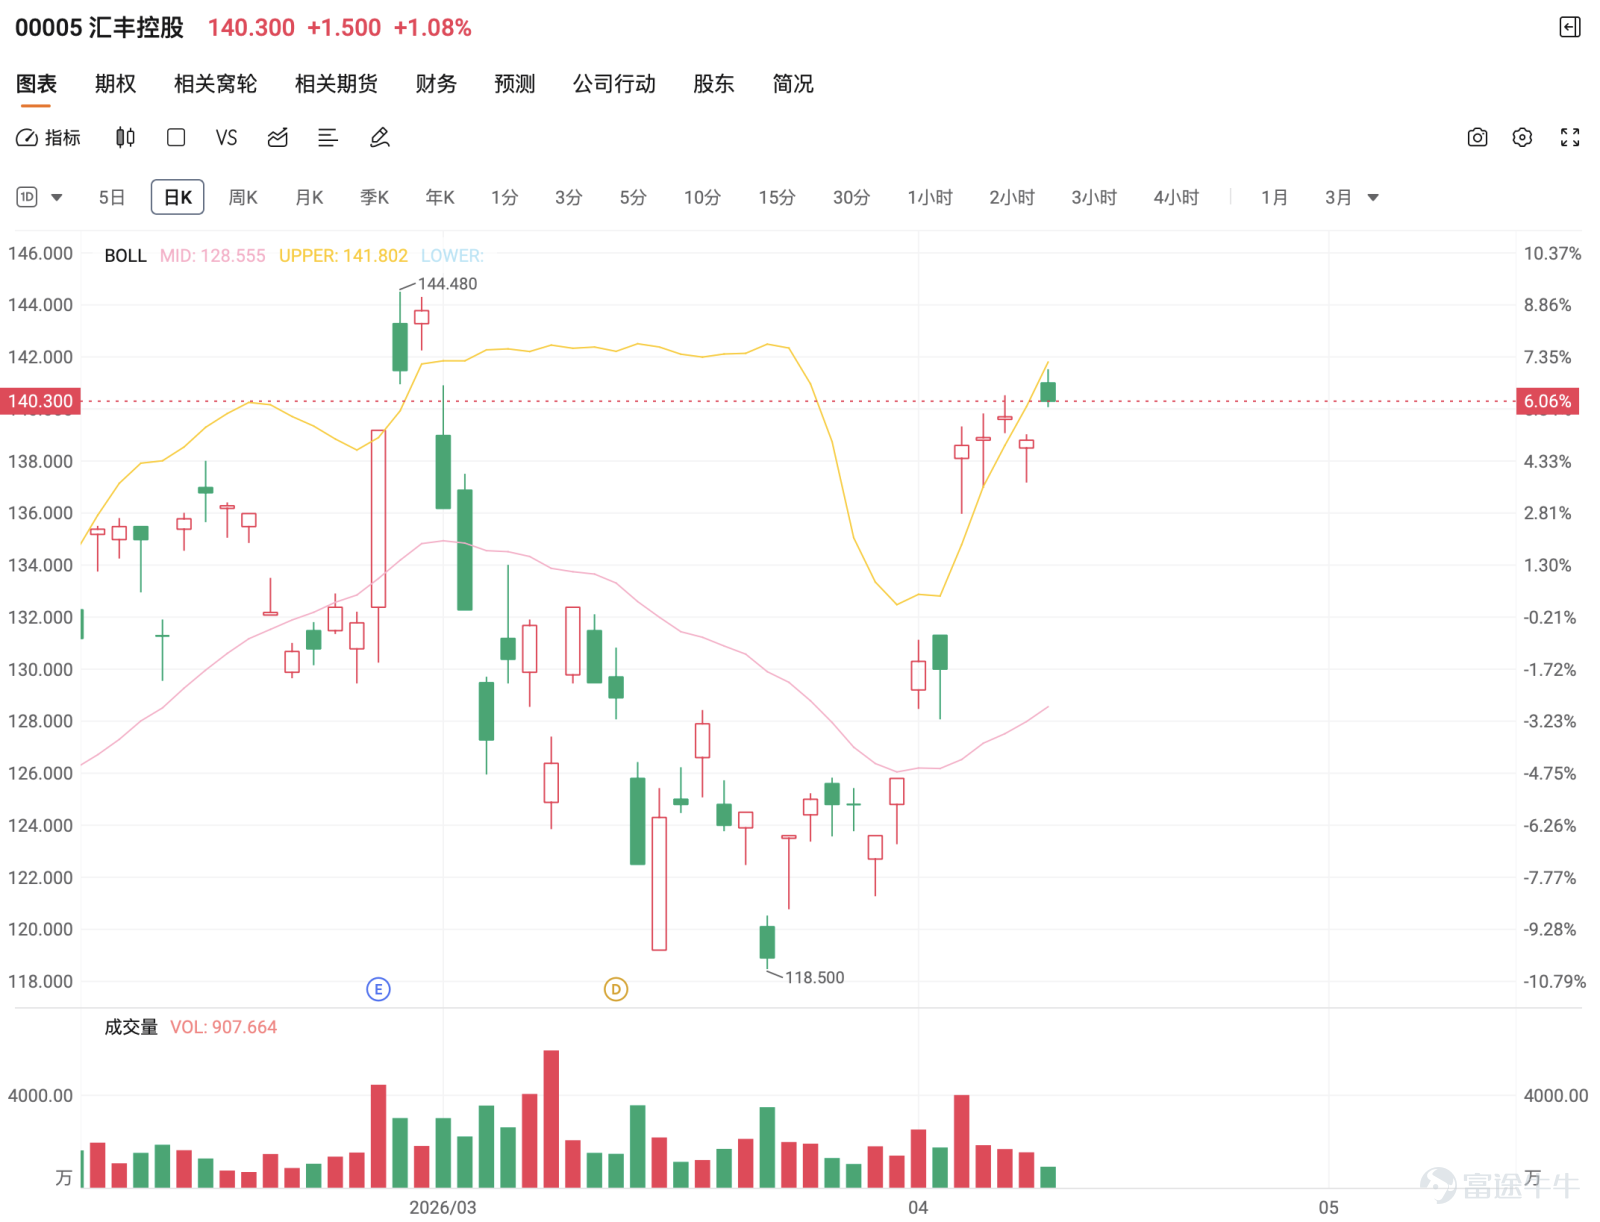
The latest data from HSBC shows the stock trading at $140.3, with a high of $141.4. Although the price hasn't been able to push higher, it remains above the 5-day, 10-day, 20-day, 30-day, and 60-day moving averages, indicating that the medium-term structure is still strong. However, as it has risen to higher levels, divergence is starting to increase.
Regarding@ ðƅ¶ƖƋ **The question of whether a 'double top' can be confirmed is indeed the most critical technical issue at present. Looking at the chart, HSBC's prior high was $144.48, and after this recent rebound, the share price is again approaching the range of $139 to $140, but it has not yet retested the previous high, nor has it broken below key moving averages. In other words, a double top has not yet truly formed. The most important aspect of a double top isn’t just that two highs are close; it’s also about a clear breakdown below the neckline or medium-term support, which hasn't happened on the current chart. Therefore, a more accurate interpretation is: consolidation at highs, but no confirmation of weakness yet.
To @Kindly Pikachu@仁慈的比卡超Some are asking 'When will it hit a new high?' while others say 'Haven't bought in yet, waiting for the right time.' This reflects the current contradiction in the market. HSBC Holdings isn't completely unchaseable, but it's no longer at a comfortably low level either. The current stock price is hovering above 138, not far from previous highs, meaning you're buying into a breakout expectation rather than a low-risk opportunity. If it can subsequently break through 139 to 140 and then challenge 141 to 144, the market will naturally perceive the uptrend as continuing. However, if it fails to break through and instead retreats, it could easily turn into a consolidation pattern at high levels.
From a structural perspective, this round of HSBC Holdings' trend remains intact. After consolidating in the middle phase, the stock price has resumed its upward trajectory. Following a recent low of 116.50, it has repeatedly rebounded. Short- and medium-term moving averages are all rising again: the 5-day line is around 137.20, the 10-day line approximately 131.53, and the 20-day line near 127.99—all below the current price. This indicates that it’s not a weak rebound but rather a strong stock operating at high levels. The issue is that the RSI is currently around 77, already at an elevated level, so further short-term gains aren’t impossible, but stronger buying power is needed to support it; otherwise, profit-taking at high levels may occur first.

Therefore, to @Dongbao@冬寶So when @冬寶 says 'it’s about to climb again,' I’d agree the direction still leans positive, but with one precondition: we need to see whether 137 to 138 can hold steady. The current pattern is indeed a strong consolidation, but it’s not a risk-free straight-up rise. As long as this range holds, there’s still potential for subsequent tests of 139, 140, or even previous highs. However, if it breaks below 137 and falls back below 136, caution is warranted as short-term consolidation could deepen.
Correct.@ ŔƋƖŹǚųFor investors like @ŔƋƖŹǚų who are buying HSBC Holdings for the first time and are concerned about dividend arrangements, what matters most isn't short-term fluctuations of one or two dollars, but understanding that HSBC Holdings differs from tech stocks. The market looks at it not just in terms of price differences but also for its role in dividend income and asset allocation. That’s why @¶śƋ MŔħǚƋ 石 would say 'there’s no way to lose at this buy-in price unless there’s a financial crisis—continue holding for dividend income.' While this statement is somewhat absolute, the underlying logic is correct: HSBC Holdings is better suited for mid-term dividend collection and stable asset allocation rather than pure short-term trading. Of course, this doesn’t mean there’s absolutely no short-term risk, but its risk profile differs from highly volatile stocks.
Yes@CloudyAndGentle breeze Saying to @云淡风轻Ƌǽ 'a second bottoming-out, don’t rush,' and later someone asking about adding positions at what price level—this kind of rhythm judgment is quite reasonable. HSBC Holdings is currently in a position where there’s no urgent need to chase higher, nor any obvious signs of deterioration. If a pullback does occur, first look at 137.20, then watch the area between 136 and 131.50—that is, the zone between the 5-day and 10-day lines. If these levels hold, it will only be consolidation after profit-taking at highs. Conversely, if even 131 can't hold, the market will start taking double-top risks more seriously.
To @The Most Beautiful Idols from Three Places vśDžǚThe approach of 'agreeing on Wednesday, rebound-selling on Friday, and buying at a low position on Monday' isn't entirely unusable for HSBC Holdings, but it’s important to note that HSBC has now entered a high-price zone. Both positive and negative news can easily become reasons for the market to switch hands at higher levels. In other words, what matters more now is not the news itself, but how the stock price reacts to the news. If the price doesn’t break above 139 to 140 despite positive news, one should be more cautious in the short term; if there's negative news but it still holds above 137, this would indicate strong underlying support.
To @CakePlusTwoPounds@蛋糕加兩磅This mindset of 'quick drops, I add,' needs to be analyzed at different levels. If you're looking at medium-term dividend income, adding during pullbacks could make sense; however, if purely short-term trading, you shouldn't use the same method. Since HSBC isn’t currently at a low position but rather near previous highs, every additional purchase should align with specific support levels, rather than simply buying because of a slight drop. The key now isn't blindly waiting for declines but determining where declines still indicate strong consolidation and where they start to turn bearish.
As for@Followers of the Short-Selling MasterThis person is the most representative, as he alternates between saying 'the five-day moving average strongly pulls up, it won’t drop,' and then says 'it will shoot down.' This flip-flopping actually reflects the current market sentiment towards HSBC: everyone acknowledges its strength but fears chasing it at high levels. This is also the most reasonable conclusion at present. The overall structure of HSBC remains relatively strong, but divergence at higher levels is increasing. It’s not that it can’t be bullish, but judgment should rely on key price levels rather than just emotions.
Overall, HSBC Holdings is still undergoing strong consolidation at high levels, without clear confirmation of a double top yet. Below, first look at 137.20, then 136, and finally 131.53; above, first look at 139 to 140, then 141 to the previous high of 144.48. At this stage, a reasonable assessment is: as long as it holds around 137, the overall trend can still be considered consolidation at high levels before testing further upward movement. If it breaks through 140, the trend might advance toward the previous high again. Conversely, if it falls below 137 and further loses 131, the risk of a double top will significantly increase.
Warrant Product Recommendations
For HSBC Holdings call warrants, consider the one issued by BNP Paribas, code 22551 $BP-HSBC@EC2606B.C (22551.HK)$ , with a strike price of 148 yuan and a leverage of 15.8 times; it has the lowest premium and implied volatility; for another call warrant issued by Bank of China, code 22630 $BI-HSBC@EC2609B.C (22630.HK)$ , with a strike price of 145.1 yuan and a leverage of 7.1 times, this is the highest leverage call warrant with relatively low premium.
For put warrants, Bank of China’s 25733 $BI-HSBC@EP2607B.P (25733.HK)$ , with a strike price of 126.56 yuan and a leverage of 8.6 times, has relatively low implied volatility; another put warrant issued by Bank of China, code 26486 $BI-HSBC@EP2609B.P (26486.HK)$ , with a strike price of 125.98 yuan and a leverage of 6.7 times, offers ideal leverage and implied volatility.
For bull and bear warrants, JPMorgan bull warrant 58923 $JP#HSBC RC2809J.C (58923.HK)$ , with a stop-loss level at 118 yuan and a leverage of 6.7 times, has a relatively low premium; UBS Group bull warrant 60754 $UB#HSBC RC2812D.C (60754.HK)$ , with a stop-loss level at 115 yuan and a leverage of 5.9 times, provides high actual leverage and low premium. For bear warrants, you may pay attention to UBS Group’s 59897 $UB#HSBC RP2702A.P (59897.HK)$ and 62177 $UB#HSBC RP2802A.P (62177.HK)$ Both have a recovery price of 150 yuan, with leverage at 13.9 times and 14 times respectively. The former has higher effective leverage and lower premium, while the latter has the lowest premium and relatively higher effective leverage.
Friendly Reminder: This article does not constitute any investment advice.
This article is for reference only and does not constitute any investment advice. The market data, opinions, and analysis contained herein may change at any time without prior notice. We are not responsible for any loss or damage caused by reliance on the information in this article. Technical analysis only shows whether certain technical conditions are met; a comprehensive assessment of asset performance should combine other data and should not solely rely on this article to make trading decisions. Please note that past performance is not indicative of future results. Follow Jenny's insights on Hong Kong stock warrants for more professional analysis.
Risk Disclaimer: The above content only represents the author's view. It does not represent any position or investment advice of Futu. Futu makes no representation or warranty.Read more


Comment (1)
to post a comment
7
12