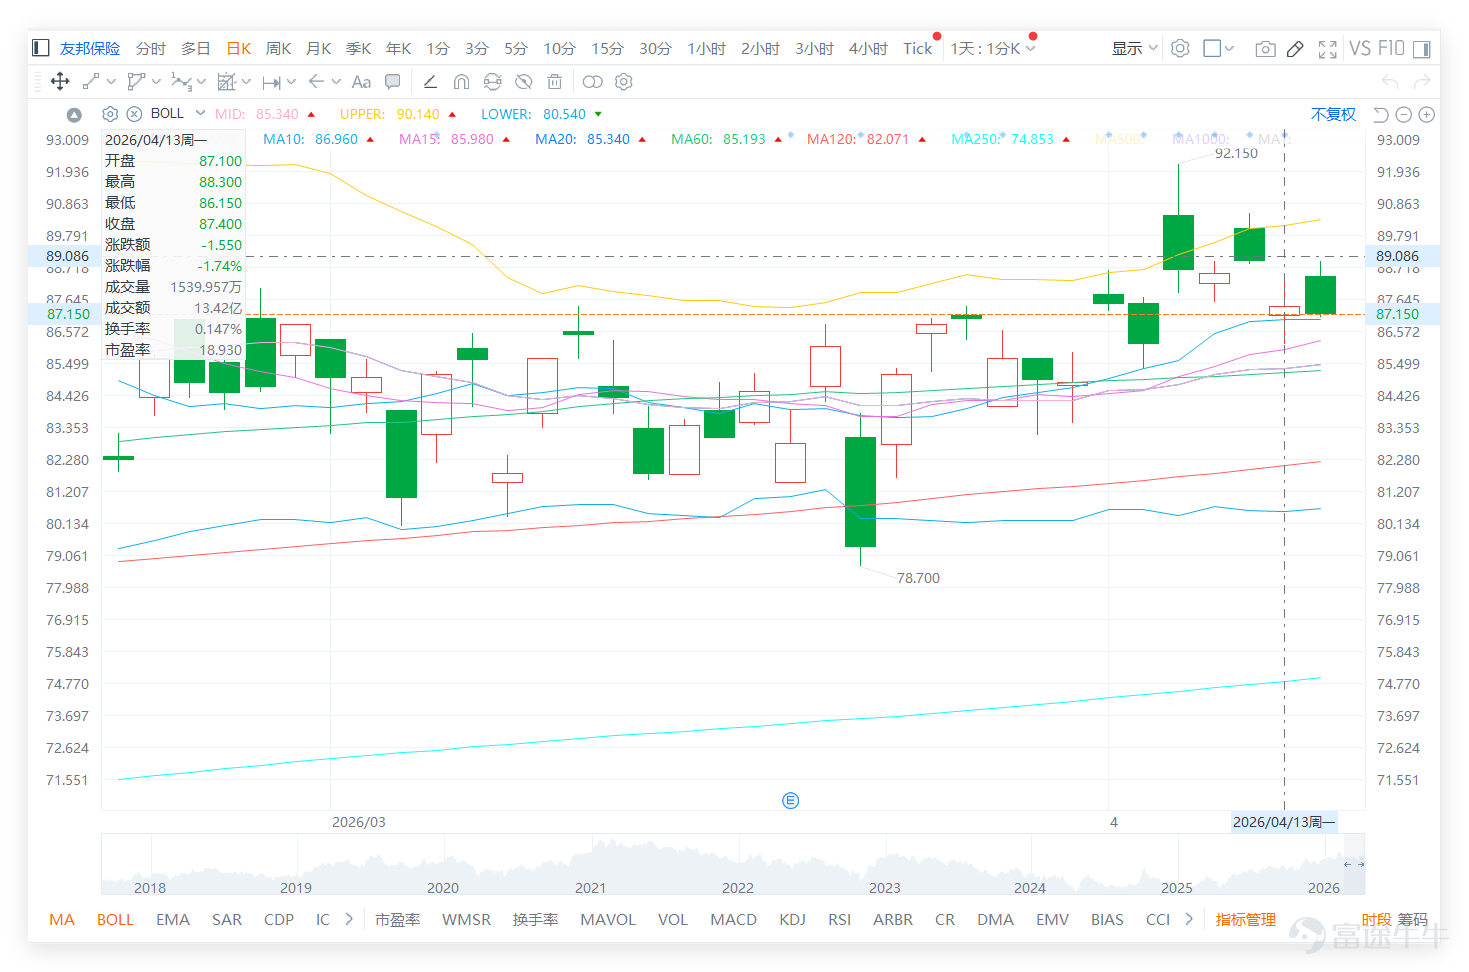

AIA is testing the support near HKD 87. In the short term, it is consolidating after a breakout. The key is whether it can hold steady at HKD 86.30.
The last trading day (April 13) closed at HKD 87.40, with an intraday high of HKD 88.30 and a low of HKD 86.15. The share price had previously surged to HKD 92.15 before pulling back and is now hovering around HKD 87. In the short term, the rapid rise has turned into consolidation at higher levels.

The main resistance above is initially seen at HKD 88.30. If it can break through again, there is a chance to test the HKD 90 to HKD 90.36 area. Beyond that, watch for the previous high at HKD 92.15. The support below is initially seen at the psychological level of HKD 87, with stronger support in the range of HKD 86.30 to HKD 86.15. Further down, pay attention to the areas around HKD 85.30 and HKD 84.30.
Structurally, the stock's mid-term trend remains above several major moving averages, showing no significant weakness overall. However, in the short term, after a sharp rise, it failed to stabilize at higher levels and started entering a retracement phase. Therefore, the current stage is more about consolidation after a breakout rather than regaining strength for another breakout or formally weakening. The short-term watershed lies in the HKD 86.30 to HKD 87 range. If this level holds, the market still has a chance to test upper resistances; if it breaks down, be prepared for further pullbacks.
Regarding@手指公向右, @アマテラス, @愛護的娜塔莉 are all asking 'Why did it drop so much?' 'What happened?' On the chart, there is actually a clear answer: AIA is not entirely weak, but it has encountered significant resistance around HKD 90. From the daily chart, the stock previously reached a high of HKD 92.15 but failed to sustain the breakout. On the last trading day (April 13), it retreated back to around HKD 87, indicating heavy selling pressure in the HKD 90 to HKD 92 range. In other words, the issue is not that the company has suddenly deteriorated, but technically, this rebound has yet to successfully evolve into a complete breakout pattern.
From the perspective of the moving average structure, AIA's current price is still roughly around the 20-day, 30-day, and 60-day lines, but it has already broken below the 5-day line. The 10-day line is approximately at HK$86.96, indicating that short-term momentum has indeed slowed, though the overall structure hasn't completely deteriorated. This kind of pattern often creates market divergence: on one hand, the trend isn’t too bad because the medium-term moving averages haven’t significantly weakened; on the other hand, every attempt to break above HK$90 in the short term always fails, making investors question whether the upward movement is merely a rebound rather than a true strengthening.
Therefore, regarding@153 VS 193 The mention of '92.X as eternal resistance, where every attempt at this level fails to break through' is actually quite close to the current chart situation. From this price movement, HK$90 to HK$92.15 is indeed AIA's most critical resistance zone at this stage. Unless it can effectively regain and stabilize within this range, the market will find it difficult to define the current trend as a full recovery. Conversely, if it can stabilize back above HK$88, then retake HK$90, and further challenge HK$92.15, this consolidation phase might have a chance to transform back into an upward trend continuation.
Yes@NN YipRegarding the question of 'what’s causing these sudden moves,' and @Yokileung feeling that 'you only keep going down while others rise,' the core issue isn't news-related but rather relative weakness. As seen on the chart, AIA has mostly been fluctuating within the HK$85 to HK$90 range recently. Although not a major drop, every upward move lacks sustainability. This suggests AIA is behaving more like a large-cap stock in consolidation rather than a strong breakout stock in the short term. Thus, for those expecting it to surge quickly like high-beta stocks, this kind of movement naturally feels dull, or even gives the impression of 'others rising while it doesn’t follow.'
As for @玩下啫 asking 'is it time to exit?' – this depends on the position. For purely short-term positions, since the stock price has now dropped back near HK$87 and has also lost support from the 5-day moving average, it is no longer in its strongest trend. However, structurally speaking, the price hasn’t yet clearly broken below the 10-day line at HK$86.96 or the 20-day line at HK$85.34, so it hasn’t fully turned bearish yet. In other words, this level is more like an observation zone between holding and not holding: if it can subsequently hold above HK$86.8 to HK$86.3 and regain HK$88, it can still be considered consolidation. But if it fails to hold even near HK$86, beware of further consolidation, potentially testing lower levels such as HK$85 or even lower.
Yes@接飞刀好疼 That sense of 'the sky is falling' emotion may not need to be overly pessimistic. Looking at the chart, AIA appears to be retesting support after pulling back from higher levels, rather than showing a completely out-of-control weakening. The problem lies in the fact that its volatility isn’t very large, yet it keeps getting capped below HK$90, which makes holders feel frustrated when they see 'it can’t break upwards, and falls back within a few days.' That’s why the most important thing now isn’t guessing whether it will immediately rebound tomorrow, but whether the range between HK$86.15 and HK$86.96 can hold.
As for @22979042牛 asking 'is there a chance it could become a red-bottom stock?' and @烟雨江南 directly suggesting 'this week, HK$100 first,' the answer should remain pragmatic for now. From a longer-term perspective, AIA certainly has the potential to rise to higher prices, but looking at the daily chart, the stock hasn’t even truly reclaimed the HK$90 to HK$92 range. Expecting it to reach HK$100 in the short term is still too optimistic. A more reasonable pace would be to first stabilize between HK$86 and HK$88, then reclaim HK$90, and finally break through HK$92.15. Only when these steps are gradually completed will the market have grounds to raise the target to HK$95 or higher, rather than jumping straight to a red-bottom scenario now.
Regarding @手指公向右 continually mentioning 'daily repurchases guarantee success without a doubt' and 'does high-priced repurchasing indicate confidence,' these ideas are common in the market. However, looking solely at the price movement, repurchases haven’t allowed the stock price to break out of its range. This demonstrates that while repurchases can provide support, they don’t necessarily mean an immediate short-term upward breakout. What truly determines the next direction is whether key technical levels can hold. For AIA right now, what matters most isn’t blind optimism but whether it can hold above HK$86.8, regain HK$88, and show sustained buying above HK$90.
Based on the above situation, deployment can be divided into two main strategies:
Strategy One: If it holds steady in the HK$86.30 to HK$87 region and breaks back above HK$88.30, consider deploying call warrants accordingly.
Issuer Code Call/Put Strike Price Actual Leverage Price Expiry Date
$UB-AIA @EC2612B.C (26937.HK)$ Call Warrant 87.880 Strike Price 4.4 Conversion Ratio 0.223 Expiry Date 2026-12-28
$HS-AIA @EC2612A.C (22975.HK)$ Call 91.700 5.3 0.163 2026-12-23
$GJ-AIA @EC2612A.C (23607.HK)$ Call 91.710 5.0 0.173 2026-12-23
Strategy Two: If the support at the 86.30 to 87 yuan range is broken and it further tests 85.30 yuan, consider deploying put warrants.
Issuer Code Call/Put Strike Price Actual Leverage Price Expiry Date
$UB-AIA @EP2612A.P (24372.HK)$ Put 77.830 4.2 0.126 2026-12-23
$HS-AIA @EP2612A.P (24219.HK)$ Put 77.860 4.1 0.127 2026-12-23
$MS-AIA @EP2606A.P (25248.HK)$ Put 69.990 10.4 0.089 2026-06-24
Overall, AIA has not yet deviated from its medium-term stable trend, but in the short term, it has entered a retracement and consolidation phase. It's not advisable to directly consider the current level as a new starting point. More importantly, observe the support in the 86.30 to 87 yuan range. If it holds above the support and moves back above 88.30 yuan, consider following the trend. If the key level is breached, prioritize defensive measures and short-term reversal strategies.
For more market analysis, stay tuned to Jenny's daily updates on 'Hong Kong Stock Warrants'!
Reminder: This article does not constitute any investment advice.
This article is for reference only and does not constitute any investment advice. The market data, opinions, and analysis contained herein may change at any time without prior notice. We are not responsible for any loss or damage caused by reliance on the information in this article. Technical analysis only shows whether certain technical conditions are met; a comprehensive assessment of asset performance should be conducted using additional data. Decisions to trade should not be based solely on this article. Please note that past performance is not indicative of future results.
#HKStocks #AIA #Real-TimeAnalysis #WarrantPick #WarrantGuide #DerivativesHedging #HKWarrantsJenny #Blue-ChipStocks #TechnicalAnalysis
Risk Disclaimer: The above content only represents the author's view. It does not represent any position or investment advice of Futu. Futu makes no representation or warranty.Read more

Comments
to post a comment
1