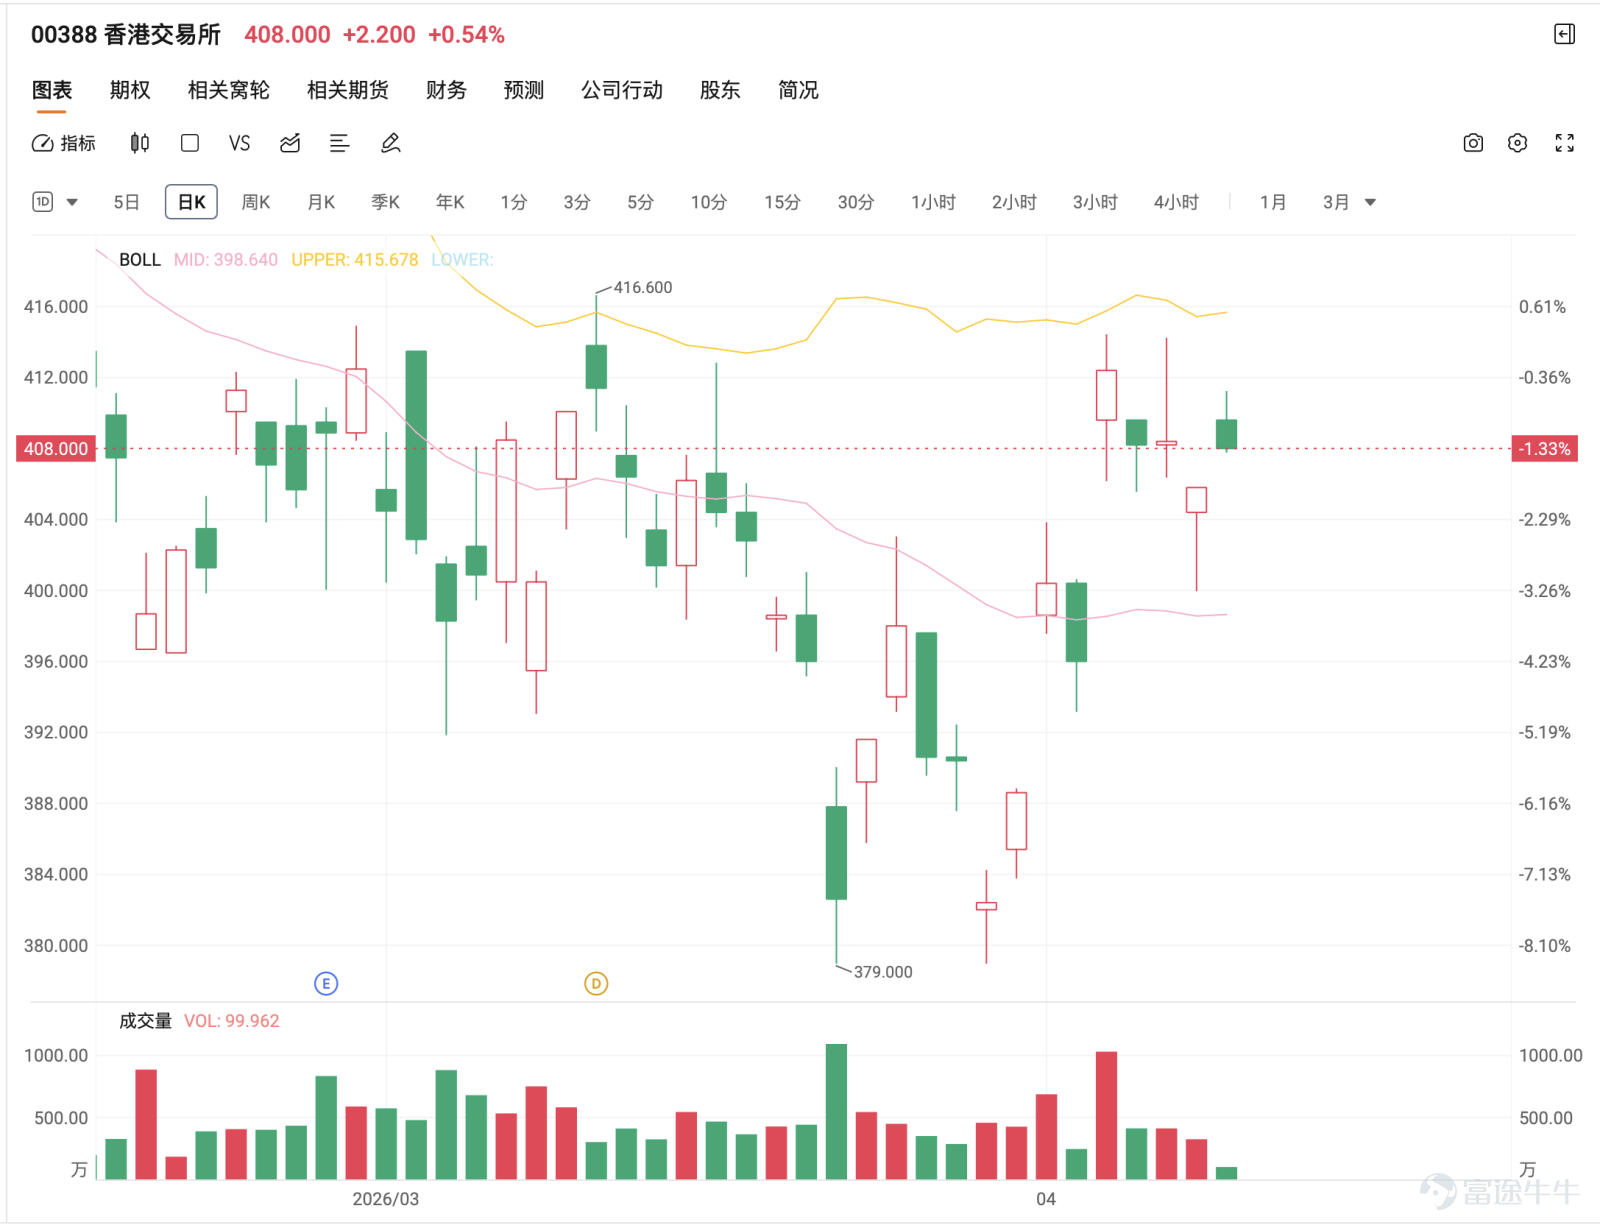

HKEX rebounded to around HKD 405, currently still in consolidation after a bounce, not yet fully regained strength
HKEX rebounded to around HKD 405, but as long as it doesn't stabilize between HKD 408 and HKD 410, the current phase is still consolidation after a rebound, not yet fully regained strength
On April 13, HKEX closed at HKD 405.80, with an intraday high of HKD 405.80 and a low of HKD 400.00. The share price had retreated from HKD 438.28 and later found support at HKD 379.00. Recently, it has gradually rebounded from the lows, returning to around HKD 405. However, it is still constrained by resistance between HKD 408 and HKD 410, as well as the crossover area of several medium- and short-term moving averages, reflecting that the short-term outlook hasn’t completely broken out of the consolidation pattern.
Today’s (April 14) share price was reported at HKD 408.The main resistance above is seen at 408 to 410 yuan. If it can effectively break through, the next level to watch is the 413.70 to 418 yuan region, followed by around 423 yuan. Support below is initially seen at 404 to 400 yuan, with key support near 398.50 to 393.30 yuan, and further down, the 388 yuan and 379 yuan areas are worth monitoring.
In terms of trend structure, the stock price is consolidating within a range after a low-level rebound; it hasn't officially broken out into strength yet, but it also hasn't weakened again. The short-term watershed lies at 400 yuan. If it can stabilize above this and break upward through 408 to 410 yuan, the rebound could extend further. If it fails to hold 400 yuan, be cautious about a downward retest of support after consolidation.

Regarding@Against the Current, PeaceAsking 'Is it okay to buy tomorrow?' and @日日輸爆廠@日日輸爆廠Mentioning being undecided about whether or not to take action near 400 yuan despite holding no shares, which is exactly the most core issue for HKEX right now. From the daily chart perspective, after rebounding from the 379 yuan low, the stock price has returned close to the 5-day, 10-day, 20-day, and 30-day moving averages, indicating that the short-term structure has indeed improved compared to its position at the lows. However, the issue is that the stock price is currently very close to the 60-day moving average at approximately 408.8 yuan, with the 120-day moving average nearby at roughly 409.9 yuan. This means that the 408 to 410 yuan zone isn't an easily surmountable area but rather a significant resistance zone.
In other words, it's not that HKEX lacks a rebound; the rebound has occurred, but its sustainability has yet to be fully proven. This aligns closely with @引頸企盼's description of 'easy to fall, hard to rise' and @金源妹’s mention of 'every time it rises, it falls back.' The market's current impatience with HKEX isn't that it doesn’t rebound at all, but that every time it rebounds to key levels, it stalls, making investors skeptical if this rebound will just be another brief correction rather than a more complete recovery.@引頸企盼The described "easy to fall, hard to rise," as well as @Jinyuanmei@金源妹The description of "every time it rallies, it immediately falls back and reverses" is quite apt. What the market is most impatient with regarding the Hong Kong Exchange right now is not that it hasn't rallied at all, but rather that its bounces often stall at critical levels, making it hard for investors to believe this rally will be more than a brief correction—and not a more sustained recovery.
From a structural perspective, HKEX previously fell from a high of 438.28 yuan and later dropped to 379 yuan before gradually rebounding recently. This indicates that the current trend remains in the phase of recovering lost ground from lower levels rather than breaking out upwards while already in a strong uptrend channel. Therefore, regarding @牛市短熊市長’s optimistic statement of 'buy now, you'll thank me in half a month,' it may not necessarily be wrong at this stage, but it shouldn't be overstated either. While the stock price has stabilized, if it cannot maintain stability above 408 to 410 yuan, the market could easily classify this as a weak rebound followed by consolidation rather than a genuine reversal of the trend.@牛市短熊市長While the optimistic claim that "buy at the current price and you'll thank me in two weeks" may not be entirely wrong at this stage, it's also unwise to be overly confident. Although the stock price has stabilized, if it fails to hold steady above 408–410 yuan, the market will likely once again view this as a weak rebound followed by consolidation—rather than a genuine reversal of the downtrend.
Regarding @Model Ancient Sky @型版古天樂The statement 'as long as it holds above 400, it's relatively safe' is correct. Because 400 is now not only a psychological level but also a significant short-term support zone. As long as the stock price remains above 400, it indicates that this recovery structure from 379 has not been disrupted; however, if it falls back below 400, especially if it breaches the 20-day line near 398, the trend will become volatile again and may even retest the range of 393 to 390.
And for @Supporting others is supporting yourself@支持別人就是支持自己 They have remained bearish, even mentioning 'watching major players manipulate retail investors,' 'selling more than buying,' and 'time to exit at 2:30 PM.' This skepticism is not difficult to understand. From the daily chart, HKEX has indeed often shown a pattern of rising one day and retreating the next, rebounding only to face resistance again. However, purely from a technical chart perspective, it has not yet reached a point of comprehensive weakness. The RSI is around 58, indicating neutral stability rather than an overheated zone, and the stock price still stands above several short- and medium-term moving averages, suggesting this rebound is not without foundation. Therefore, a more accurate description should be: the current situation represents consolidation amid improvement—not entirely safe, but not immediately bearish either.
As for @Welcome to be rivals@歡迎做對家 They are quite critical of the buyback mechanism, viewing buybacks as merely smoke screens. This view reflects market skepticism about whether fundamental support for HKEX can translate into a rising stock price. However, returning to the daily chart, the most practical short-term focus is not debating the buyback itself, but watching whether the stock price can hold above 400 for several consecutive days and gradually reclaim the range of 408 to 410. Only by achieving this can the market perception shift from 'rally followed by decline' to 'starting to see a more complete recovery.'
Looking at the upside potential, if HKEX can effectively break through 408.65 and stabilize above 409.9, it will then have the conditions to advance towards 413 to 415. This is why, for @Daily factory loss For this type of investor who wants to know whether the current price is worth entering, a more reasonable strategy at this stage is not to blindly chase but to either wait for a breakout confirmation or observe support during pullbacks. Because if you chase near the resistance area and the stock price faces resistance again and retreats, the psychological pressure would be considerable.
For @Thumbs up pointing right @手指公向右The comment 'Can the Hong Kong Exchanges cancel the auction?' actually reflects more of investors' frustration with end-of-day stock price volatility. From a trend perspective, what makes holders of Hong Kong Exchanges most uncomfortable during this period is not how deep the absolute decline is, but rather that every time there seems to be hope, it gets suppressed again. Therefore, what is most worth observing now is not a sudden intraday spike, but whether it can remain steadily above HKD 400 for several consecutive days, and then gradually test the resistance zone. This kind of movement will be more important for improving market confidence than a one-day surge.
Overall, the situation for the Hong Kong Exchanges has improved compared to its lows; the rebound and recovery structure is still in place, but the area around HKD 405 remains a tug-of-war zone. Until the range of HKD 408 to 410 is broken through, it cannot be considered fully strengthened. At this stage, a more reasonable judgment is: as long as HKD 400 holds, the recovery structure can continue. If it can further stabilize at HKD 408 to 410, the trend might extend towards HKD 413 to 415. Conversely, if it falls back below HKD 400, beware that this rebound may once again turn into a short-lived recovery.
Strategy One: If it holds steady above HKD 400 and breaks through HKD 408 to 410, consider deploying call warrants accordingly.
Issuer Code Call/Put Strike Price Actual Leverage Price Expiration Date
Strategy Two: If it breaks below 400, and further falls below 398.50 to 393.30, consider deploying put warrants.
Issuer Code Call/Put Strike Price Actual Leverage Price Expiry Date
Overall, HKEX is still in a consolidation phase after the rebound and has not yet confirmed a full strengthening trend. The key now is to observe whether the support at 400 can hold and whether the resistance zone of 408 to 410 can be successfully broken through. If support holds and an upward breakout occurs, the short-term rebound may continue. However, if the area between 400 and 398.50 breaks again, it would indicate there's further downward pressure even after consolidation, and deployment should remain cautious.
Reminder: This article does not constitute any investment advice.
This article is for reference only and does not constitute any investment advice. The market data, opinions, and analysis contained herein may change at any time without prior notice. We are not responsible for any loss or damage caused by reliance on the information in this article. Technical analysis only shows whether certain technical conditions are met; a comprehensive assessment of asset performance should combine other data and should not solely rely on this article to make trading decisions. Please note that past performance is not indicative of future results. Follow Jenny's insights on Hong Kong stock warrants for more professional analysis.
Risk Disclaimer: The above content only represents the author's view. It does not represent any position or investment advice of Futu. Futu makes no representation or warranty.Read more
Comments (3)
to post a comment
11