
Pop Mart is struggling around the 150 yuan mark; is this a temporary stabilization after profit-taking at highs, or a technical rebound within a weak trend?
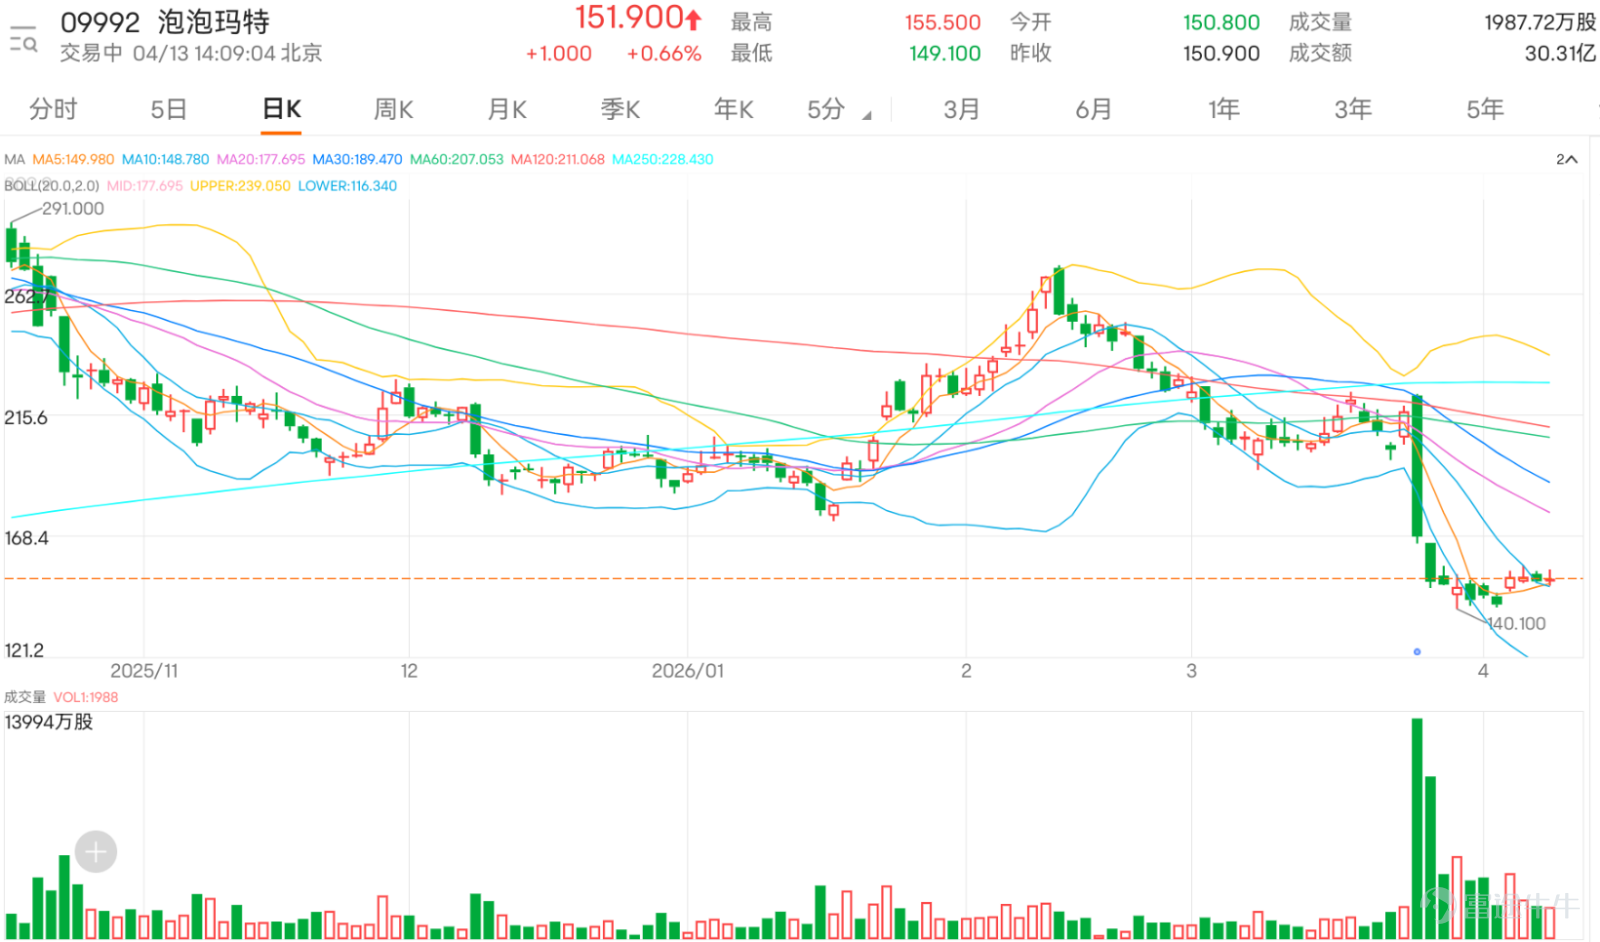
According to the daily chart, $POP MART (09992.HK)$ The latest price is 151.9 yuan, with today's high at 155.5 yuan and low at 149.1 yuan. Looking at the overall structure, after retreating from its peak of 274.2 yuan, the stock price once plunged sharply to 140.1 yuan. Subsequently, it has been hovering near the 150 yuan level, indicating that the market has shifted from previous one-sided exuberance into a period of repeated digestion following a pullback from highs.

Technically, the most critical aspect at this stage is not single-day fluctuations, but rather that although the stock price is currently holding steady around the 150-yuan mark, it remains significantly below key medium-term moving averages. Chart-wise, the 5-day moving average is approximately 150.02 yuan, and the 10-day moving average is about 148.8 yuan, meaning the current price is just slightly above short-term moving averages. However, the 20-day moving average is still near 178 yuan, the 30-day moving average is around 190 yuan, and the 60-day moving average is even higher at 207 yuan, reflecting that the medium-term structure remains weak and has yet to fully recover. The Bollinger Bands’ middle band is approximately at 180 yuan, and the lower band is around 116 yuan, while the current share price is still close to the lower half of the range, suggesting that the market is merely stabilizing somewhat after previously entering oversold territory due to a sharp drop. There are not yet sufficient conditions to prove it has returned to a more complete upward structure.
In terms of momentum, the RSI in the chart is still hovering around the mid-30s, showing that after the recent sharp decline, it entered a technically weaker state, even nearing oversold levels. Currently, there is only an initial stabilization, without any strong recovery momentum. This also explains why market sentiment is so divided: some believe it has fallen deeply enough to anticipate a rebound, while others have begun questioning whether this is simply a high-valuation stock undergoing a bubble correction.
Based on investors' comments, market sentiment has indeed shown clear divergence. For instance, @三大准则 one investor frankly stated, 'The trend over the past two to three days has been the same. I originally thought it was improving, but now I estimate it will return to around 130 next week,' reflecting that some investors already interpret the current trend as a continuation of weakness; moreover, @233915691 another described the entire pullback as 'from 300 → 270 → 250 → 230 → 200 → 190 → 150.' This statement strongly reflects the market's perception of Pop Mart: every time people think it has bottomed out, it drops another level. On the contrary, @@财散人安 mentioned 'end-of-month at 230, we'll review again later,' while @散畏市场大力士 noted 'Pop Mart’s Q1 revenue is estimated to increase by 65% year-over-year,' indicating that some investors are still willing to assign a higher valuation based on fundamental growth.
Notably, these comments aren't just general retail investors shouting about rises or falls; there are now clear signs of valuation skepticism, volatility trading, and even hedging thinking. For example, @Cai010313 mentioned transaction costs, and others discussed puts, annualized returns, and hedging, showing that Pop Mart is no longer just a 'high-growth trendy toy stock' narrative—it's entering a phase of high volatility, significant divergence, and heightened emotional trading. When a stock shifts from everyone talking about its story to discussing costs, hedging, and who dares to pick the bottom, it typically means it has moved from unilateral hype into a phase where valuations need to be re-evaluated.
Therefore, a reasonable assessment of Pop Mart at this stage isn't 'it has bottomed out' or 'it will definitely collapse further,' but rather: the stock price has stabilized temporarily around 150 yuan, but overall it remains in a weak structure undergoing repair. If it can hold steady between 150 yuan and 147 yuan going forward and regain a position above 154.9 yuan, there may be an opportunity for a short-term rebound test towards 160 yuan. However, if it breaks below 150 yuan again, or even falls below 147 yuan, the market will naturally refocus on the previous low of 140.1 yuan.
In other words, what matters most for Pop Mart now isn't how much it rose in the past, but whether it can transition from 'profit-taking at highs' to 'stable recovery' after the sharp decline. Until it regains the 20-day moving average, the current phase should be viewed as an initial rebound and bottom-building observation period within a weak trend, not yet a full return to strength.
Strategy 1: Only consider a continuation of the short-term rebound if the price stabilizes above 154.90 yuan and then breaks above 160 yuan.
If the price can first stabilize above 154.90 yuan and then break above 160 yuan, it would indicate that the short-term rebound might shift from being purely technical to a more sustainable rebound trend. However, given that the overall trend is still below the medium-term moving averages, any rebound at this stage must overcome resistance levels before confirming a genuine reversal of the downtrend.
$UBPOMRT@EC2609D.C (27992.HK)$ | Strike Price: 210.12 yuan | Actual Leverage: 4.1x | Suitable for deploying a short-term rebound continuation strategy if the price stabilizes above 154.90 yuan and breaks through 160 yuan.
$CTPOMRT@EC2609D.C (28018.HK)$ |Strike Price 186.78 yuan|Actual Leverage 4.3x|Moderately high leverage, suitable for deploying bullish trades following a breakout above resistance.
$HSPOMRT@EC2609B.C (27794.HK)$ |Strike Price 189.92 yuan|Actual Leverage 4.2x|Balanced terms, ideal for short-term call options after confirming stability above the resistance zone.
Strategy Two: If the price falls below 150 yuan and retreats further towards 145 yuan, consider deploying bearish positions accordingly.
If the share price falls below 150 yuan and drops further to around 145 yuan, it indicates that the sideways consolidation pattern near the lows has failed, and weakness may intensify. In this scenario, deploying bearish positions aligns better with the current structure, as the focus shifts from consolidation at the lows to testing lower support, representing a continuation of weakness.
$UBPOMRT@EP2607A.P (22558.HK)$ |Strike Price 162.82 yuan|Actual Leverage 3.1x|Suitable for bearish deployment if the stock price breaks below 150 yuan, aiming to capture a decline towards the 145 yuan range.
$BPPOMRT@EP2607A.P (24971.HK)$ |Strike Price 162.90 yuan|Actual Leverage 3.0x|Similar terms, suitable for short-term bearish plays following a breakdown below 150 yuan.
$BIPOMRT@EP2607A.P (23340.HK)$ |Strike Price 162.82 yuan|Actual Leverage 2.9x|Slightly lower leverage, making it a more balanced choice for bearish strategies.
Strategy Three: If even 140.10 yuan fails to hold, it signals an expansion of the downtrend, warranting preparation for further weakness.
If the share price falls below the previous low of 140.10 yuan, it indicates that the defensive line formed after the sharp decline has been breached. At this point, the overall downtrend is likely to deepen, and the market may enter an even weaker phase. In this case, it is more appropriate to choose bearish warrants that can handle further weakness, rather than interpreting the movement as simple range-bound fluctuations.
$DSPOMRT@EP2607A.P (25110.HK)$ |Strike Price 169.90 yuan|Actual Leverage 2.7x|Ideal for bearish continuation plays if the previous low is broken, addressing potential further downside expansion.
$MBPOMRT@EP2608A.P (22126.HK)$ |Strike price 169.992 yuan|Actual leverage 2.4x|Lower leverage, more suitable as a relatively balanced short position choice after breaking through the previous low.
$HUPOMRT@EP2609B.P (27726.HK)$ |Strike price 135.00 yuan|Actual leverage 3.1x|Strike price closer to further downward testing area, suitable for capturing an even weaker move after the previous low is breached.
Key Deployment PointsPop Mart at this stage still remains in a weak pattern; before stabilizing again between 154.90 and 160 yuan, it should only be viewed as bearish with potential fluctuations after a drop. In terms of operations, the more顺势approach is still to take a bearish view following a break below 150 yuan. If the previous low at 140.10 yuan is also broken downwards, then one must beware of the decline expanding further. Only when the stock price re-establishes above the resistance zone will long call options have stronger technical grounds for short-term deployment.

For more market analysis, stay tuned to Jenny's daily updates on 'Hong Kong Stock Warrants'!
Reminder: This article does not constitute any investment advice.
This article is for reference only and does not constitute any investment advice. The market data, opinions, and analysis contained herein may change at any time without prior notice. We are not responsible for any loss or damage caused by reliance on the information in this article. Technical analysis only shows whether certain technical conditions are met; a comprehensive assessment of asset performance should be conducted using additional data. Decisions to trade should not be based solely on this article. Please note that past performance is not indicative of future results.
#HongKongStocks #RealTimeAnalysis #WarrantsSelection #WarrantsStrategy #DerivativesHedging #HongKongWarrantsJenny #PopMart #09992 #NewConsumptionStocks$Hang Seng Index (800000.HK)$$Hang Seng TECH Index (800700.HK)$
Risk Disclaimer: The above content only represents the author's view. It does not represent any position or investment advice of Futu. Futu makes no representation or warranty.Read more
Comment (1)
to post a comment