Simultaneous pressure on the Red Sea and the Strait of Hormuz drives international oil prices higher

CNOOC remains in a pullback and consolidation phase from its recent highs; until it recaptures 27 yuan, the short-term trend cannot be considered strong again.
The most important thing to focus on now is not how much it dropped in a single day, but whether the pullback from the high of 30.98 yuan to the mid-26 yuan range represents normal consolidation or if there is still further downside.
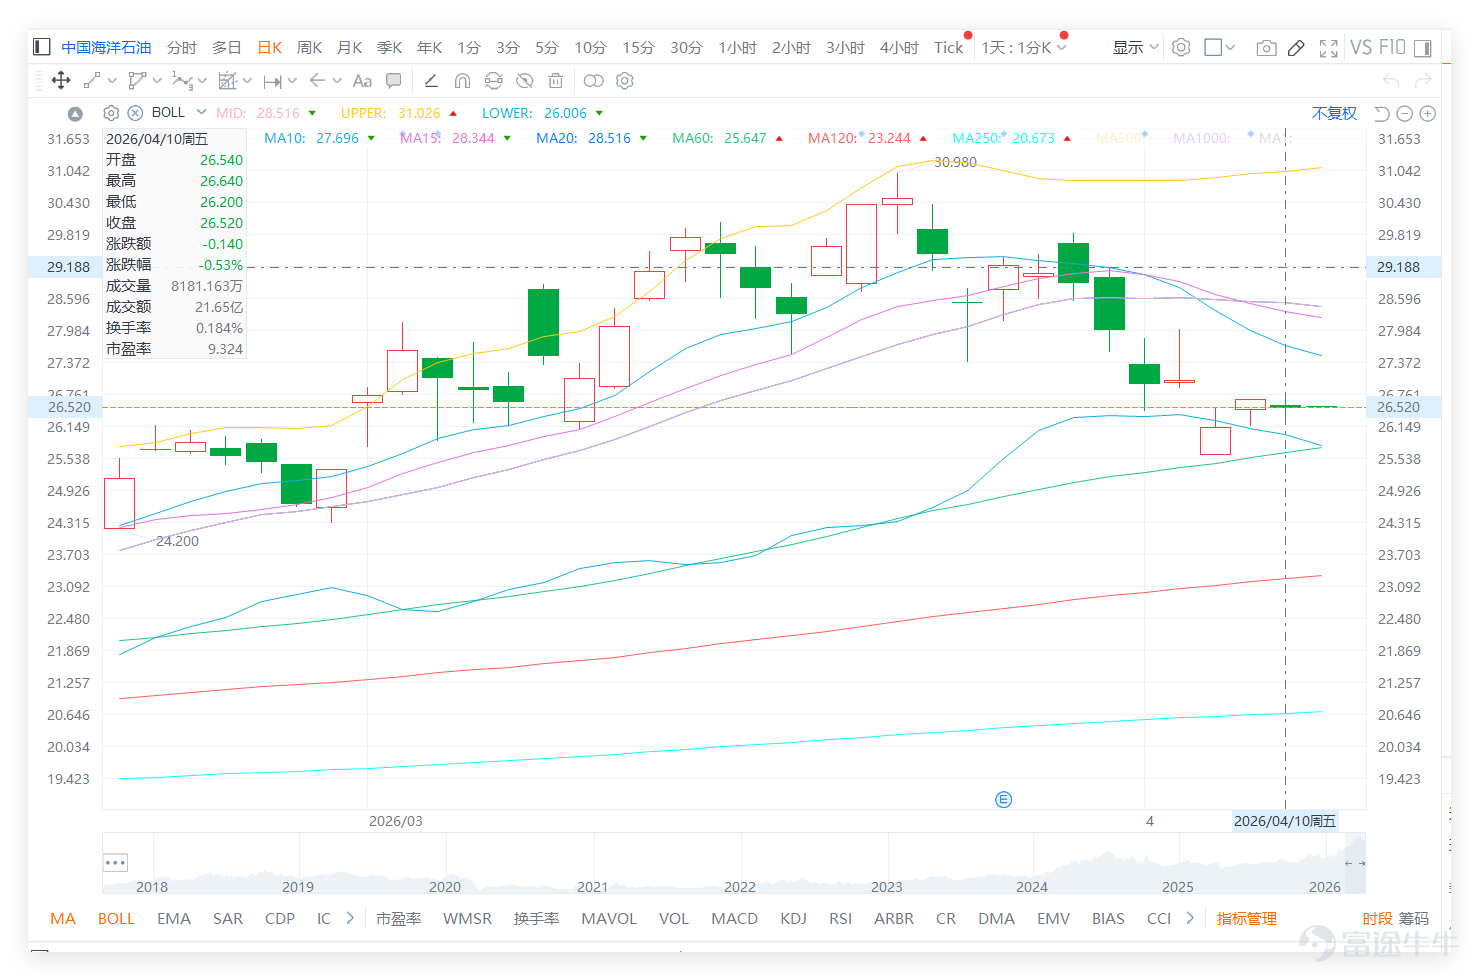
The latest daily chart shows that CNOOC closed at 26.52 yuan on April 10th, with an intraday high of 26.64 yuan and a low of 26.20 yuan.

The share price has now clearly retreated below the 5-day, 10-day, 20-day, and 30-day moving averages, indicating weakening short-term structure. It is also approaching the lower Bollinger Band, reflecting market caution about future performance. However, the current price has returned closer to the previous key support zone. Therefore, the focus now is not on whether it has strong fundamentals, but whether it can stabilize around 26 yuan to avoid further testing of 25 yuan.
From a technical perspective, immediate support lies between 26.2 yuan and 26 yuan, which is the closest support zone. If this level fails, the next target will be between 25.5 yuan and 25 yuan, an area that has been widely discussed in comment sections. On the resistance side, the first levels to watch are between 27 yuan and 27.2 yuan, followed by 28 yuan above that. If the stock merely fluctuates around the mid-26 yuan range without regaining 27 yuan, the market may interpret this as a continuation of weak consolidation. Conversely, if buying emerges near 26 yuan and the price gradually reclaims 27 yuan, this pullback could be seen as a healthier correction.
From investors' comments, the market's most pressing issue is clear: whether the mid-26 yuan range is a deployment point or still not an attractive enough level. For instance, @長沽米到24Such opinions clearly assume that the share price may still have room to fall further. This sentiment is quite representative because it reflects that, although the market acknowledges CNOOC’s solid fundamentals, there remains a lack of confidence in the short-term price dynamics. Especially when oil prices and geopolitical situations fluctuate, investors naturally focus on lower levels like 25 yuan or even 24 yuan, waiting for a clearer margin of safety.
On the other hand, many investors view the current price as a mid-term dividend yield or staged deployment zone. For example, @周期上升中、@毫無保留的肥仔This kind of deployment-oriented commentary isn't betting on a quick short-term rebound but instead sees CNOOC as a high-dividend, leading oil and gas stock with value after a pullback. This perspective is common because CNOOC’s appeal has never been solely about stock price elasticity, but also its high dividends, defensive nature, and profit leverage when oil prices rise. The challenge is that while these advantages exist, whether the short-term share price will immediately respond remains heavily influenced by external factors.
In terms of short-term reward-to-risk ratio, CNOOC currently represents a conditional opportunity but leans towards a conservative risk-reward profile. This is because the current price is close to the 26 yuan support zone. If the 26 to 26.2 yuan range holds, there is potential for a rebound to 27 to 27.2 yuan, or even 28 yuan, providing some upside with a risk-reward ratio that isn’t entirely unattractive. However, if the 26 yuan level breaks down, expectations for 25 yuan or lower will quickly rise, significantly weakening the reward-to-risk ratio. In other words, the current logic isn’t based on "it will definitely rebound," but rather whether there is sufficient buying interest around the 26 yuan mark.
Based on the above situation, the deployment can be divided into three main strategies:
Strategy One: Only consider bullish trades if the price stabilizes above 27.00 yuan and subsequently breaks through 27.70 to 28.00 yuan.
If the price can first stabilize above 27.00 yuan and then break through the 27.70 to 28.00 yuan resistance, this would indicate that short-term selling pressure is easing, allowing the trend to potentially shift from consolidation to a more sustained rebound. Until this breakout is confirmed, it’s premature to conclude a return to strength, so bullish positions should be considered only after confirming the upward momentum.
$UBCNOOC@EC2609B.C (26708.HK)$ | Strike price 29.88 yuan | Actual leverage 6.9 times | Mid-distance out-of-the-money, suitable for deployment on a rebound after confirming the stock price rises back above 27 yuan and breaks through the resistance zone.
$JPCNOOC@EC2609A.C (27023.HK)$ | Strike price 29.90 yuan | Actual leverage 6.8 times | Similar terms, suitable for short-term bullish deployment after confirmation of a breakout.
$SGCNOOC@EC2611C.C (27004.HK)$ | Strike price 35.32 yuan | Actual leverage 6.9 times | Higher strike price, suitable for deployment targeting an extended rebound after a breakout.
Strategy Two: If the price retraces to between 26.00 yuan and 25.65 yuan and holds steady, a more balanced call option can be used to bet on a continued rebound.
If the stock price retraces to between 26.00 yuan and 25.65 yuan and remains stable, it indicates that support near the 60-day moving average is still effective, and the current correction hasn't worsened further. The market may still have an opportunity to consolidate within the support zone before resuming the rebound. This type of strategy doesn’t require waiting for a strong breakout to enter; instead, it leverages the support zone's ability to sustain a rebound. Therefore, options with closer strike prices and more balanced terms are more suitable.
$HSCNOOC@EC2611A.C (24557.HK)$ | Strike price 25.90 yuan | Actual leverage 5.5 times | Closer strike price, balanced terms, suitable for betting on a rebound continuation after defending mid-term support.
$BICNOOC@EC2611A.C (28139.HK)$ | Strike price 25.90 yuan | Actual leverage 5.6 times | Comparable leverage, suitable for a relatively stable rebound deployment once support around 25.65 yuan is confirmed effective.
$HUCNOOC@EC2611A.C (29102.HK)$ | Strike price 25.90 yuan | Actual leverage 5.9 times | Slightly higher leverage, suitable for more aggressive short-term call options after securing the support zone.
Strategy Three: If the price breaks below 25.65 yuan and tests 24.90 yuan, switch to put options.
If the stock price falls below 25.65 yuan, it means the 60-day moving average support has been broken, and the overall adjustment could escalate from a normal pullback to a deeper downward test, with the next target gradually pointing towards 24.90 yuan. In this scenario, deploying put options aligns better with the trend structure as the market focus will shift from defending support and betting on a rebound to following the downtrend after breaking through support.
$UBCNOOC@EP2609A.P (26838.HK)$ | Strike price 24.86 yuan | Actual leverage 5.0 times | Closer to a short-term weakening scenario, suitable for bearish bets if 25.65 yuan is breached.
$CICNOOC@EP2609A.P (26582.HK)$ | Strike price 24.88 yuan | Actual leverage 5.0 times | Similar terms, suitable for direct short-term put options deployment if the support level is broken.
$CTCNOOC@EP2609A.P (27165.HK)$ | Strike price 22.48 yuan | Actual leverage 6.6 times | Lower strike price with higher leverage, suitable for aggressive downside bets after breaking through key support levels.
Key Deployment Points
CNOOC is currently in a weak consolidation phase following a pullback from higher levels. Unless the price recaptures 27 yuan, it should not be considered to have regained strength. In terms of strategy, a clearer approach would be to wait for the stock price to stabilize around 25.65 yuan before considering a rebound call option play; if 25.65 yuan is breached, one must guard against further downside expansion, and put options would then be more aligned with the trend.
For more market analysis, stay tuned to Jenny's daily updates on 'Hong Kong Stock Warrants'!
Reminder: This article does not constitute any investment advice.
This article is for reference only and does not constitute any investment advice. The market data, opinions, and analysis contained herein may change at any time without prior notice. We are not responsible for any loss or damage caused by reliance on the information in this article. Technical analysis only shows whether certain technical conditions are met; a comprehensive assessment of asset performance should be conducted using additional data. Decisions to trade should not be based solely on this article. Please note that past performance is not indicative of future results.
#HKStocks #CNOOC #Real-TimeAnalysis #WarrantPick #WarrantGuide #DerivativesHedging #HKWarrantsJenny #Blue-ChipStocks #TechnicalAnalysis
Risk Disclaimer: The above content only represents the author's view. It does not represent any position or investment advice of Futu. Futu makes no representation or warranty.Read more
Comments (3)
to post a comment
1