
After Tencent (0700) rebounded and approached the 20-day moving average, should short-term warrants bet on continuation or wait for a breakout before accelerating?
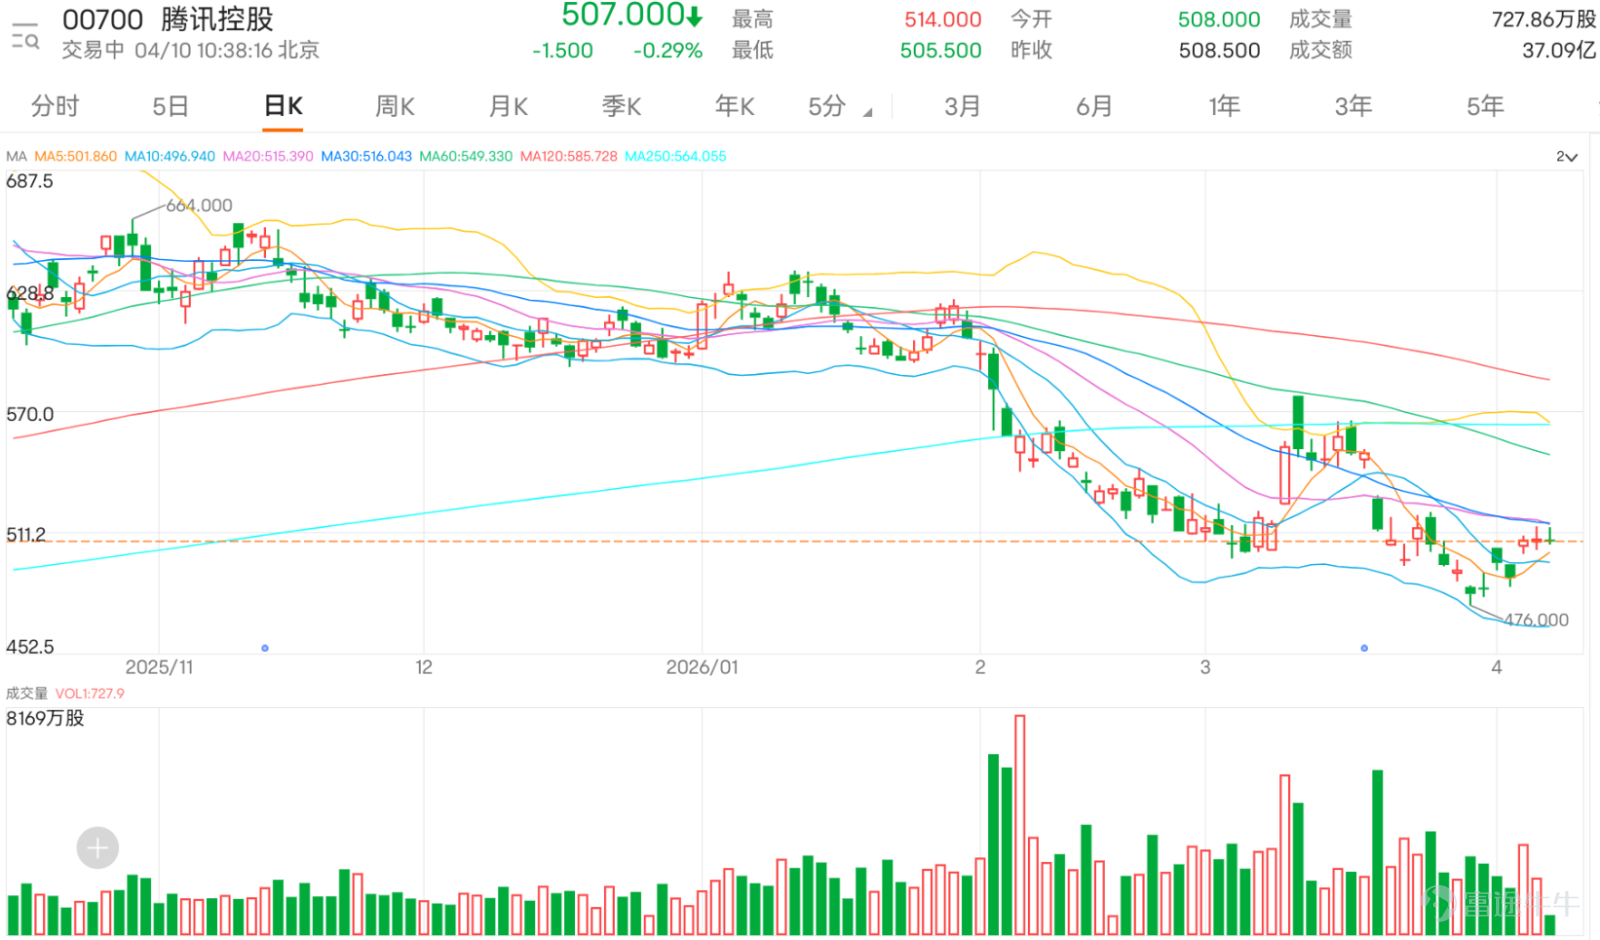
$TENCENT (00700.HK)$ Latest report at HKD 507, intraday high at HKD 514, low at HKD 505.50. After rebounding from the low of HKD 476, the stock price has gradually returned to above HKD 500. However, looking at the overall structure, although the current price has regained support above the 5-day and 10-day moving averages, it is still capped by resistance near the 20-day moving average at HKD 517.7 and the 30-day moving average at HKD 516.5, reflecting that the trend is closer to testing resistance during a rebound after a decline, rather than fully confirming a reversal to strength.
Technically, Tencent's short-term support levels are around HKD 500 to HKD 503, which is a recent consolidation area and also where immediate market capital inflows have resumed; if this level breaks down further, the next support zone would be near HKD 490, with the more critical defensive line remaining at the previous low of HKD 476. On the resistance side, first look at HKD 517 to HKD 518, where the 20-day moving average overlaps with the Bollinger Band midline. If the price can break through and stabilize above this level, there could be an opportunity to test HKD 533 to HKD 535 next; if further recovery occurs, conditions may allow pushing towards HKD 547 to HKD 551. The RSI has risen above 50, indicating improved short-term momentum compared to earlier but not yet reaching overbought territory. Therefore, what’s most worth observing in terms of the trend is not whether a rebound will occur, but whether the rebound can evolve into a breakout.
In this context, Tencent’s short-term warrant strategy should avoid being overly simplistic, with a more reasonable approach involving three stages: The first stage involves maintaining stability around HKD 500, using relatively balanced products to bet on a continued rebound; the second stage waits for a clear breakthrough of the resistance between HKD 517 and HKD 518 before following up with trend-aligned products; the third stage considers using higher-elasticity products to chase the second wave of upward movement if the stock price stabilizes above HKD 533.

Strategy One: Defend around HKD 500, betting on a continued rebound
This type of deployment follows the idea that 'support has not been lost, and the rebound has not ended.' The focus is not on pursuing maximum explosiveness but on capturing a continued rebound from HKD 500 to near HKD 517 after the stock price stabilizes in the support zone. In such scenarios, products with closer strike prices and more balanced leverage are more suitable.
$UBTENCT@EC2812A.C (27205.HK)$ This option can be considered a stable choice in this group, with a strike price of 449.00 yuan and an actual leverage of about 2.6 times. The characteristic of this product is that the strike price is relatively close, the leverage is not high, and its movement follows the underlying stock more naturally. It is suitable for a stable deployment when Tencent holds steady around 500 yuan. If Tencent slowly rises and approaches the resistance at 517 yuan again, these types of products are more likely to follow the rhythm of the underlying stock.
$JPTENCT@EC2812A.C (26218.HK)$ It is also suitable for this phase of deployment, with a strike price of 448.80 yuan and an actual leverage of about 2.4 times. Its features are similar to the previous product, belonging to the category of close-to-the-money, low-to-medium leverage, with the advantage being that volatility won't be overly drastic. This makes it more appropriate to use during the early stages of a rebound that hasn’t been fully confirmed. If the market merely continues to recover rather than surging quickly, this type of product will be easier to manage.
The key to this strategy lies in ensuring the area around 500 yuan does not show significant breakdown. If it breaks down further towards 490 yuan, the logic supporting the continuation of the rebound weakens.
Strategy Two: Follow up after breaking through 517 to 518 yuan, aiming for a test of 533 yuan.
If Tencent breaks through the overlapping resistance zone of the 20-day and 30-day moving averages at 517 to 518 yuan, it indicates that the share price is transitioning from a simple rebound to challenging higher-level resistance. At this point, warrant strategies can shift from conservative types to moderately flexible momentum-following products.
$UBTENCT@EC2708A.C (27567.HK)$ This product in the group is worth noting, with a strike price of 580.50 yuan and actual leverage of approximately 4.1 times. Its feature is that the distance between the strike price and the current price is moderate, offering higher leverage compared to Strategy One but without being overly aggressive. It is suitable for following up right after the share price breaks through the first level of resistance. If Tencent can effectively stabilize above 518 yuan and move towards 530 yuan, this kind of product will have a reasonable response.
$BIXIAMI@EC2606D.C (22796.HK)$ Similarly, it can be used as part of this strategy, with a strike price of 580.50 yuan and actual leverage of about 4.0 times. This product is similar in type to UBS Group’s 27567, classified as a medium-leverage momentum-following product. Its advantage is that the pace isn’t too fast, making it suitable for capturing a more orderly rise in the early stages of a breakout. If the market moves gradually upwards instead of spiking intraday, this type of product has more practical value.
The focus of this strategy is that there must be a breakout first before considering following up. If the share price remains fluctuating between 508 and 515 yuan, deploying such products prematurely may not offer the highest reward-to-risk ratio.
Strategy Three: Reclaiming levels above 533 yuan, then chasing the second phase of the upward trend.
If Tencent manages to break through 533 to 535 yuan, it means that the share price has not only recovered from the short- to medium-term moving average pressure but also started approaching the highs of the previous rebound. In such cases, market sentiment usually improves significantly compared to the current stage. Deployment can then consider using higher-flexibility products to aim for a second upward push from 533 yuan towards 547 to 551 yuan.
$UBTENCT@EC2609D.C (27928.HK)$ This is one of the more noteworthy aggressive plays, with a strike price of 600.40 yuan and an actual leverage of approximately 8.4 times. Its distinguishing feature is that the leverage has clearly increased, making it a medium to high elasticity product suitable for deployment after Tencent’s share price has shown clear signs of strengthening. If Tencent breaks through 533 yuan and accelerates further, this type of product will respond directly to the upward movement.
$SGTENCT@EC2608D.C (26497.HK)$ This is an even more aggressive momentum choice, with a strike price of 629.38 yuan and an actual leverage of around 10.7 times. The characteristic of such products is higher leverage and stronger explosive potential, making them suitable when Tencent's share price enters the second phase of accelerated ascent. If Tencent moves from 533 yuan to 547 yuan or higher, the elasticity of these products will be more pronounced. However, high-leverage products demand stricter timing, so they should only be considered after the uptrend has become relatively clear.
Short-term Trading Strategy Summary
Overall, Tencent is currently at a pivotal point between a post-decline rebound and officially transitioning into a stronger trend. Technically, the situation has improved compared to the low at 476 yuan, but it has yet to truly break through the short-term critical resistance level of 517 to 518 yuan. Therefore, the most reasonable approach for short-term trading is not solely relying on directional judgment, but progressively upgrading based on price levels.
If the share price merely holds steady near 500 yuan, it would be appropriate to first use closer-to-the-money, more balanced products to bet on a continuation of the rebound. If it breaks above 517 to 518 yuan, medium-leverage products can be used to follow the trend. Only if it firmly stabilizes above 533 yuan would it be worthwhile to deploy higher-elasticity products to chase the second wave of the uptrend. Conversely, if 500 yuan is breached, the short-term betting value would decrease, and at that point, one should reassess support around 490 yuan or even 476 yuan.

For more market analysis, stay tuned to Jenny's daily updates on 'Hong Kong Stock Warrants'!
Reminder: This article does not constitute any investment advice.
This article is for reference only and does not constitute any investment advice. The market data, opinions, and analysis contained herein may change at any time without prior notice. We are not responsible for any loss or damage caused by reliance on the information in this article. Technical analysis only shows whether certain technical conditions are met; a comprehensive assessment of asset performance should be conducted using additional data. Decisions to trade should not be based solely on this article. Please note that past performance is not indicative of future results.
#HongKongStocks #RealTimeAnalysis #WarrantsSelection #WarrantsStrategy #DerivativesHedging #HongKongWarrantsJenny #Tencent #00700 #TechStocks$Hang Seng Index (800000.HK)$$Hang Seng TECH Index (800700.HK)$
Risk Disclaimer: The above content only represents the author's view. It does not represent any position or investment advice of Futu. Futu makes no representation or warranty.Read more

Comments
to post a comment
2
4