
Ganfeng Lithium is approaching the 80 yuan mark, with clear signs of sector strength. However, the current price has entered a high volatility zone. Is this still part of the main upward trend or is it at a point where profit-taking is most likely?
As of the close on April 9th, $GANFENGLITHIUM (01772.HK)$
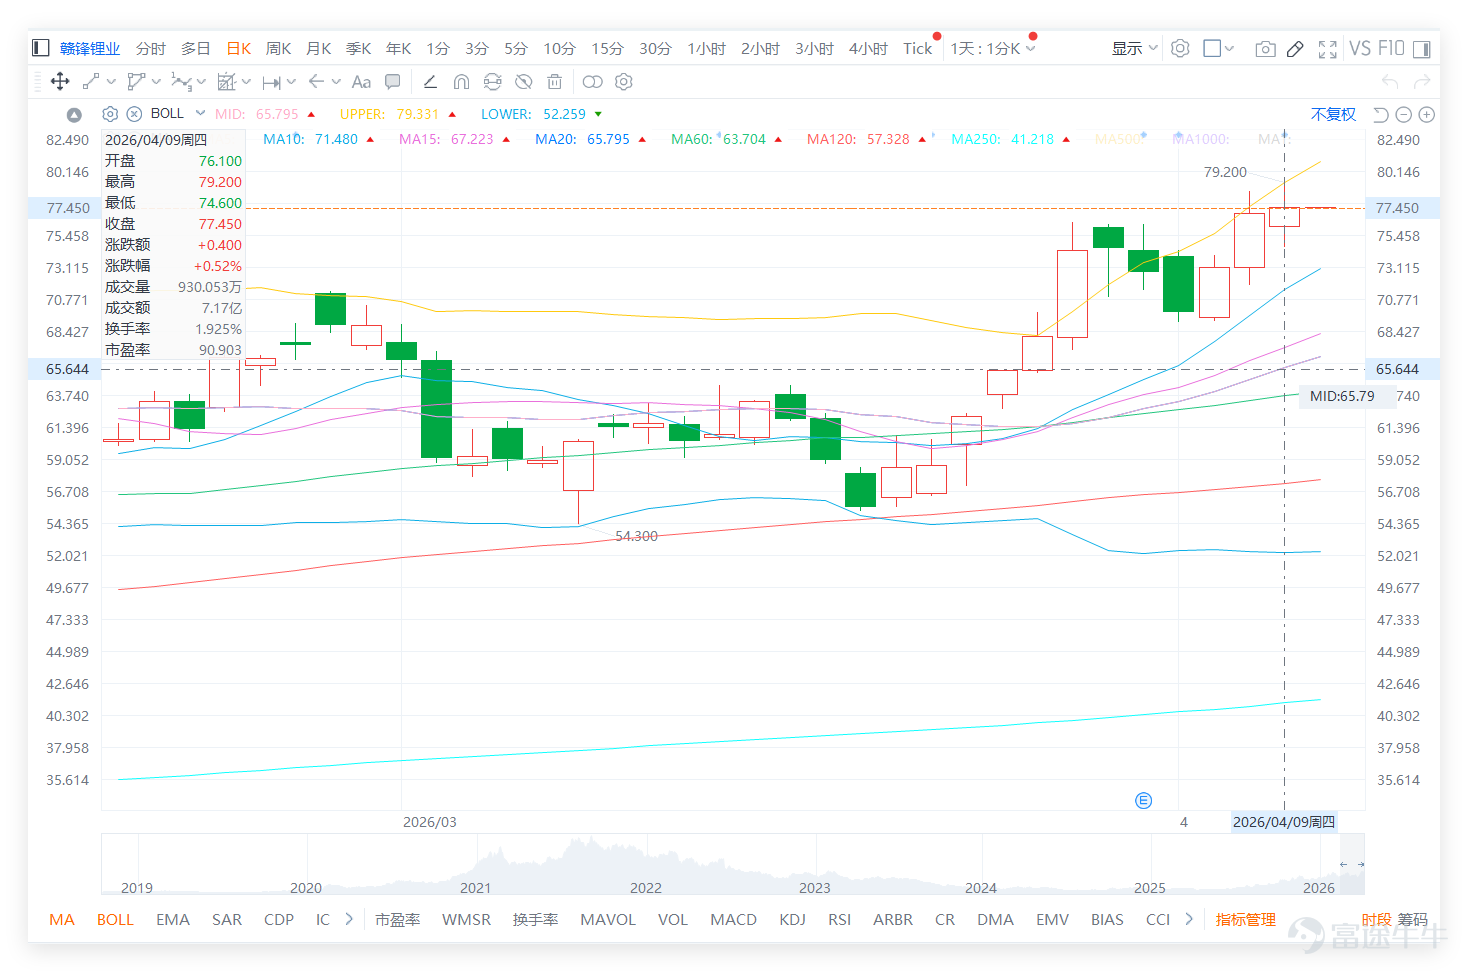
The latest closing price was 77.450 yuan, rising 0.400 yuan in a single day, with an increase of 0.52%. The intraday high was 79.200 yuan, and the low was 74.600 yuan. The opening price was 76.100 yuan, with a turnover of approximately 717 million yuan. Looking at the recent daily chart, the stock price has been repeatedly pushed up from a low of 53.200 yuan, and the uptrend has recently accelerated significantly, now nearing the 80 yuan integer mark. This indicates that Ganfeng’s current movement is no longer just a technical rebound but has entered a strong extension phase under intense market attention.
Technically, Ganfeng Lithium currently exhibits a clear bullish alignment. The 5-day moving average is around 74.040 yuan, the 10-day moving average is about 71.480 yuan, the 20-day moving average is around 65.795 yuan, the 30-day moving average is about 65.022 yuan, the 60-day moving average is about 63.704 yuan, the 120-day moving average is about 57.328 yuan, and the 250-day moving average is around 41.180 yuan. The current price is above all major moving averages, indicating very strong short- to medium-term structure. The middle Bollinger Band is approximately 65.795 yuan, the upper band is about 79.331 yuan, and the lower band is around 52.259 yuan. The current price is approaching the upper band, which typically represents strong upward momentum but also implies the possibility of entering a period of high volatility and oscillation in the short term. RSI is around 63 to 76, already in the overheated zone, indicating that momentum remains strong but the risk of chasing higher prices rises accordingly.

In terms of support levels, the first level to watch is 74.60 yuan, followed by around 74 yuan. If these levels are breached, the next support would be at 71.48 yuan. On the resistance side, the near-term range to watch is between 79.20 yuan and 80 yuan, followed by the 85 yuan area. In other words, Ganfeng's conditions for upward movement are clear: First, it must hold above 74.6 yuan; second, it needs to break through 79.2 to 80 yuan effectively; third, if it can stabilize above 80, the market will naturally shift its target to 85 yuan. Conversely, downside risks are also straightforward: If 74.6 yuan is breached, short-term profit-taking may occur, leading the stock into a more pronounced consolidation phase.
Judging from investor comments, market sentiment towards Ganfeng is clearly much more optimistic than before. For instance, @韭菜炒c鸡蛋The comment 'This month started with a rise, which feels a bit unusual' is quite representative. This is because investors have grown accustomed to the weakness and volatility of lithium stocks. Now that the sector is starting to strengthen, the market finds it unnatural. This 'unfamiliarity' often indicates that the investment style is already shifting.
More directly, it is@散戶投資者01It was mentioned that lithium-related stocks are collectively gaining strength, pointing out that the sector effect is very noticeable. From a chart perspective, this observation is supported because Ganfeng's rise is not an isolated case; rather, risk appetite across the entire lithium sector is improving. This is why some feel that 'it’s getting a bit strong now, no longer following futures.' When a stock starts to break away from being dragged by short-term external factors, it usually means the market is treating it as one of the leading stocks in the sector.@168JackyYou'll sense, "It's a bit too strong right now—it's no longer following the futures." When a stock stops being dragged along by short-term moves in the broader market, it usually means the market is treating it as one of the key players in its sector.
One of the most technically insightful comments suggested raising the defensive stop-loss to HKD 74.6. If it holds above that level, the next target will be breaking through 80. This framework aligns well with the chart. For Ganfeng, the key now is no longer guessing whether it can double but whether it can maintain a strong structure above HKD 74.6, then aim for the next push between HKD 79.2 and 80.@型版古天樂This would push the defensive stop-loss level up to RMB 74.6; if the stock can stabilize and hold above that level, it will first break through RMB 80. This framework is actually very consistent with the chart pattern. For Ganfeng at this stage, the key is no longer whether it can double in price, but rather whether it can maintain a strong structural momentum above RMB 74.6 and then launch the next round of upward pressure toward RMB 79.2 to RMB 80.
In summary, Ganfeng Lithium's current positioning is as a candidate for a strong upward trend amidst a strengthening sector, but it is approaching the 80 yuan mark, a level prone to profit-taking. Its advantage lies in its clear bullish pattern, with capital visibly willing to chase gains. However, the issue is that the stock has become overheated in the short term, and 80 yuan is where market expectations are highly concentrated. For short-term investors, the priority isn’t blindly dreaming of reaching 100 yuan but monitoring if 74.6 yuan holds and if there is an effective breakout between 79.2 yuan and 80 yuan. If it holds and breaks through successfully, Ganfeng could upgrade from a 'strong rebound stock' to a 'sector-leading momentum stock.' Otherwise, it may undergo a shakeout at the height of excitement.
Reminder: This article does not constitute any investment advice.
This article is for reference only and does not constitute any investment advice. The market data, opinions, and analysis contained herein may change at any time without prior notice. We are not responsible for any loss or damage caused by reliance on the information in this article. Technical analysis only shows whether certain technical conditions are met; a comprehensive assessment of asset performance should be conducted using additional data. Decisions to trade should not be based solely on this article. Please note that past performance is not indicative of future results.
Risk Disclaimer: The above content only represents the author's view. It does not represent any position or investment advice of Futu. Futu makes no representation or warranty.Read more

Comments
to post a comment
2