Alibaba (9988) pulls back after an AI strategy upgrade, with the support level at HKD 118.9 becoming a short-term key.
Alibaba (09988.HK) has seen increased volatility in its stock price recently, influenced by the upgrade of its AI strategy and diverging views from major banks. As of April 9, 2026, Alibaba closed at HKD 122.7, down 3%, with an intraday low of HKD 122.0 and trading volume of approximately HKD 8.496 billion. On April 8, the stock was boosted by news of an AI organizational adjustment, closing at HKD 126.5, a one-day surge of 6.75%, with trading volume reaching HKD 22.723 billion, contributing 122.42 points to the Hang Seng Index. On the morning of April 9, the stock followed the broader market downward, with the market focusing on the support level at the HKD 120 mark.
Technical Analysis
From a technical chart perspective, Alibaba's share price rebounded from around HKD 117, near the April 2 low, and on April 8 tested the 20-day moving average at approximately HKD 127. On April 9, it retreated along with tech stocks. Based on technical data as of April 9, Alibaba’s first support level is around HKD 118.9, which is the starting point of the April 2 rebound and a recent consolidation zone; a more critical second support level is at HKD 108.9, equivalent to the late-March correction low. In terms of resistance levels, the first resistance is at HKD 129.7, and if it breaks through, the next resistance is at HKD 136.9, corresponding to the February high region.
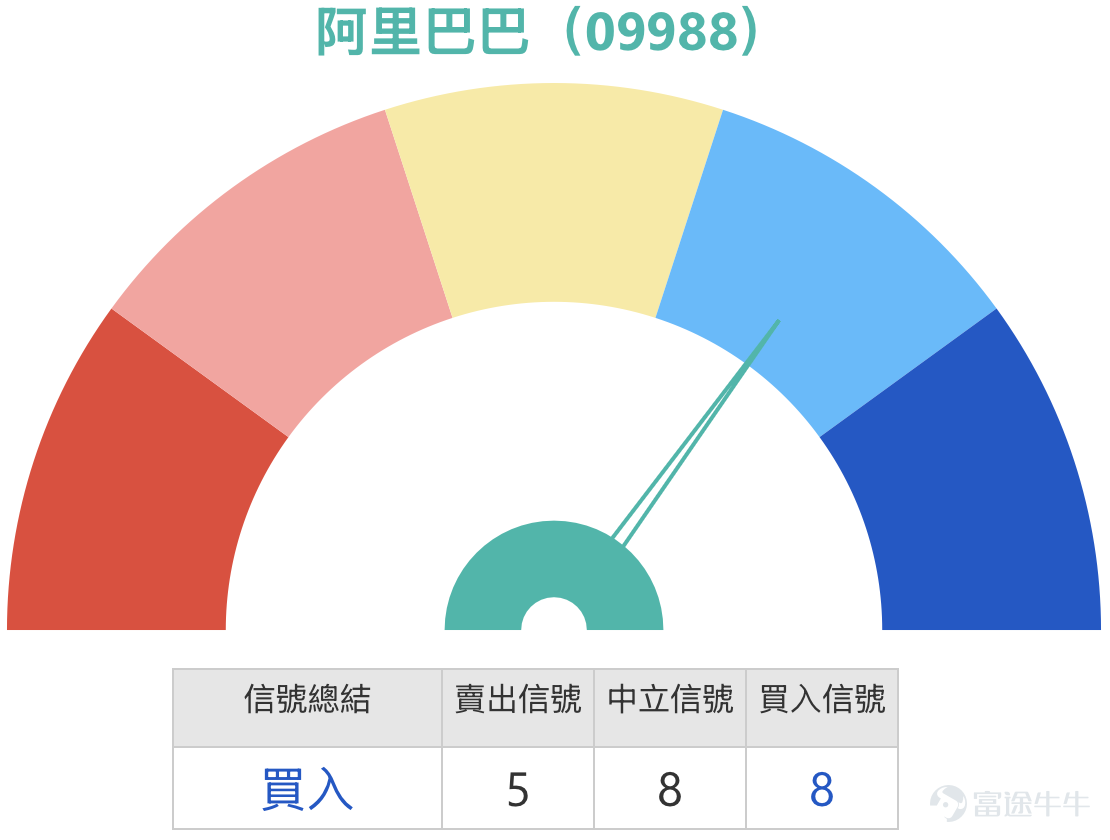
In terms of technical indicators, the overall signal is 'Buy', with a total of 8 buy signals. The RSI is at 42, on the edge of the weak zone. Multiple oscillation indicators show neutral signals. The Rate of Change (ROC) indicator shows a signal of 'severely oversold, possibly bottoming out, buy'; the bull-bear power indicator suggests buying, although the MACD and Bollinger Bands indicate selling, confirming that the medium-term downtrend has not been fully reversed. Overall, current technical signals suggest a 'pullback after a rebound from oversold conditions' pattern, with the stock likely to trade within the range of HKD 118.9 to HKD 129.7 in the short term. Whether it can hold above HKD 118.9 will be the short-term key.

Market News Integration
On the news front, Alibaba’s AI strategic layout has accelerated significantly recently. On April 8, Group CEO Wu Yongming issued an internal letter announcing organizational adjustments related to AI, including the establishment of the Group Technology Committee (with Wu Yongming personally serving as the head), upgrading the Tongyi Large Model Business Unit (led by Zhou Jingren), and accelerating AI development. Previously, on March 16, Alibaba had established the Alibaba Token Hub (ATH) business group, creating a new organization with the core goal of 'creating tokens, delivering tokens, and applying tokens'. With two organizational adjustments in just one month, the company is concentrating its strongest technical capabilities and most critical resources into the AI main battlefield, reflecting the high importance placed on the AI strategy.
Regarding large models, Alibaba’s Qwen 3.6-Plus model has shown outstanding performance. According to the weekly usage rankings published by OpenRouter, a well-known third-party API platform for large models, Qwen 3.6-Plus topped the daily rankings for four consecutive days, continuing to attract market attention. Additionally, market rumors indicate that Alibaba and Unitree Robotics are planning an overseas strategic partnership, with Unitree’s latest robot R1 spotted at Alibaba’s Xixi campus, sparking market imagination about AI application scenarios.
Diverging views have emerged among major banks. Citi issued a research report on April 9, forecasting that Alibaba's customer management revenue (CMR) for the fourth quarter of fiscal year 2026 will grow by 1.3% year-over-year, with growth of 1.6% in fiscal year 2027. The report highlights that the reduction in losses for Taobao Flash Purchase is proceeding faster than expected, which will support a stronger rebound in EBITA for Alibaba’s China e-commerce business. The bank maintained its 'Buy' rating and raised its target price to HKD 204. UBS Group also issued a report on the same day, expecting Alibaba's revenue for the fourth quarter of fiscal year 2026 to remain flat at RMB 237 billion, with an EBITA of approximately RMB 26 billion for the China e-commerce segment. The firm assigned a 'Buy' rating with a target price of HKD 166. JPMorgan, on the other hand, lowered its target price to HKD 195, noting that Alibaba's stock price has already seen significant revaluation driven by optimism over AI infrastructure development, with cloud computing revenue growth being the primary financial support.
Review of Warrant Products
In terms of a review of warrant products, several derivatives related to Alibaba mentioned on April 2, 2026, showed significant performance in the subsequent two trading days (up to April 4). During this period, the underlying stock, Alibaba, rose by 3.71%, while the related bullish products demonstrated strong leverage effects: JPMorgan bull certificate (66071) surged by 31%, UBS Group bull certificate rose by 37%, HSBC call warrant (26739) increased by 29%, and UBS Group call warrant (26541) also rose by 28%. The data clearly shows that the gains of bull certificates and call warrants far exceeded those of the underlying stock, illustrating the core characteristic of leveraged products—allowing investors to capture movements in the underlying stock with less capital, thereby amplifying returns.

Warrant product recommendations and comparisons
With Alibaba's current stock price at HKD 123.1, alongside support levels at HKD 118.9 and HKD 108.9, and resistance levels at HKD 129.7 and HKD 136.9, investors can choose appropriate products based on their own outlook. Below is a comparison of four selected call warrants and bull/bear certificates:
For call warrants, HSBC call warrant (26739) has a strike price of HKD 137.09, offering about 8.4x leverage. This product features the lowest premium and implied volatility among similar offerings, making it suitable for cost-effective bullish strategies. Based on the current stock price, it is approximately 11.4% out-of-the-money, close to the first resistance level at HKD 129.7, making it ideal for investors expecting the stock price to break through HKD 129.7. UBS Group call warrant (26541), also with a strike price of HKD 137.09, offers about 7.8x leverage and relatively low implied volatility, making it suitable for investors concerned with volatility risk.
For bull certificates, JPMorgan bull certificate (59339) has a stop-loss level at HKD 111.2, providing actual leverage of about 9.2x. This product has relatively low premiums, with the stop-loss level approximately HKD 11.9 below the current stock price, ensuring sufficient safety margin. UBS Group bull certificate (54592) has a stop-loss level at HKD 110, offering actual leverage of about 7.7x and also featuring relatively low premiums. Its stop-loss level is slightly lower than JPMorgan’s product, but still provides a good safety margin.
Two highlighted bullish products:
- HSBC call warrant (26739) $HSALIBA@EC2607C.C (26739.HK)$: Featuring the lowest premium and implied volatility, with 8.4x leverage, it is the most ideal choice for bullish deployment considering comprehensive terms.
- JPMorgan bull certificate (59339) $JP#ALIBARC2607V.C (59339.HK)$: With actual leverage of 9.2x, the stop-loss level at HKD 111.2 is much lower than the support level at HKD 118.9, providing a sufficient safety margin, making it suitable for conservative investors.
For bearish strategies, put warrants worth noting include HSBC put warrant (27507) with a strike price of HKD 99.95 and leverage of 3.6x; this product has relatively favorable leverage and implied volatility. Another option is UBS Group put warrant (27306) with a strike price of HKD 99.95 and leverage of 3.4x, featuring relatively lower implied volatility. When choosing put warrants, note that the strike price of HKD 99.95 is far below the current stock price, classifying it as an out-of-the-money product. If the stock price falls below the support level at HKD 118.9, these products are expected to perform more ideally.
For bear contracts, consider JPMorgan's bear contract (65210) with a recovery price of $142, offering an actual leverage of 6.9 times and relatively low premium; another option is JPMorgan's bear contract (69024) with a recovery price of $144, providing the highest actual leverage of 6.2 times and a lower premium. When selecting bear contracts, ensure the recovery price is above resistance levels of $129.7 and $136.9. The recovery prices of $142 and $144 are above both resistance levels, providing sufficient safety margin, making it suitable for investors expecting stock prices to fall back from resistance levels.
Two selected bearish products:
- HSBC put warrant (27507) $HSALIBA@EP2701A.P (27507.HK)$: Leverage of 3.6 times, implied volatility is relatively ideal, making it a balanced choice for bearish deployment.
- JPMorgan bear contract (69024) $JP#ALIBARP2809H.P (69024.HK)$: Actual leverage of 6.2 times, recovery price of $144 is above the resistance level, providing the highest actual leverage, suitable for aggressive short-term bearish investors.

Overall, Alibaba's stock price is currently in a technical rebound phase driven by AI strategy upgrades. The $123 level is being contested, and the support level at $118.9 will determine the short-term direction. Fundamentally, positive factors such as organizational adjustments in AI, continuous leadership in large models like Qwen, and net buying by Southbound funds are concentrated, but there is significant divergence among major banks on earnings expectations, indicating short-term uncertainty remains. Investors should strictly control risks when deploying, choose appropriate derivatives based on key support levels at $118.9 and $108.9 and resistance levels at $129.7 and $136.9, and pay attention to how out-of-the-money levels impact product performance.
Interactive Q&A:
Dear readers, do you think Alibaba (09988) can hold the support level at $118.9 in the short term?
A) Yes, benefiting from AI strategy upgrades and inflows of Southbound funds, testing the resistance at $129.7
B) No, the support at $118.9 is being tested, a retest of $108.9 is needed
C) Fluctuating repeatedly within the range of $118.9 to $129.7
Feel free to share your views in the comment section!
Reminder: This article does not constitute any investment advice.
This article is for reference only and does not constitute any investment advice. The market data, opinions, and analysis contained herein may change at any time without prior notice. We are not responsible for any loss or damage caused by reliance on the information in this article. Technical analysis only shows whether certain technical conditions are met; a comprehensive assessment of asset performance should combine other data and should not solely rely on this article to make trading decisions. Please note that past performance is not indicative of future results. Follow Jenny's insights on Hong Kong stock warrants for more professional analysis.
#Alibaba# #Hong Kong Stocks# #Technical Analysis# #Support and Resistance Levels# #Warrants# #Bull and Bear Certificates# #Call Warrants# #Put Warrants# #AI Strategy# #Hong Kong Stock Warrants Jenny#
Risk Disclaimer: The above content only represents the author's view. It does not represent any position or investment advice of Futu. Futu makes no representation or warranty.Read more
Comments
to post a comment