
Energy transition accelerates! Which electric vehicle stocks stand to benefit the most amid high oil

The battle for the key level of BYD (01211), is a buying opportunity emerging?
$BYD COMPANY (01211.HK)$ The stock fell by 4.4%, hitting an intraday low of 101.9 yuan, making it one of the worst-performing blue chips at the moment. In terms of news, yesterday BYD launched its premium brand Denza in Paris, entering the European high-end automobile market. To leverage its battery advantage, the company plans to install 'flash charging' equipment in France. Additionally, the group aims to deploy 20,000 'flash charging' stations across China by the end of the year and promote them overseas.
BYD's current share price has fallen below the 10-day moving average (105.36 yuan) but remains above the 30-day moving average (100.93 yuan) and the 60-day moving average (98.90 yuan). This suggests that short-term momentum has slightly slowed, but the medium-to-long term upward trend structure remains intact. The moving averages still present a bullish formation, providing some underlying support for future performance.
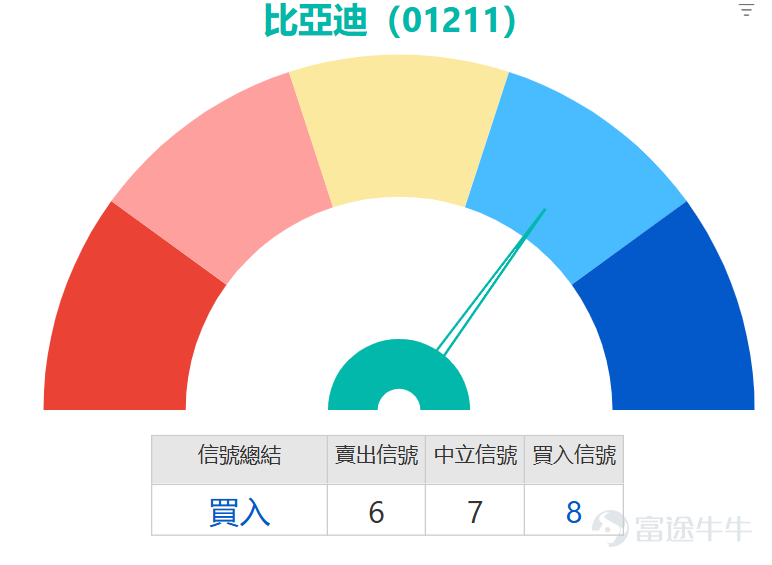
Based on technical indicator analysis, the market presents a mixed picture, but overall signals lean toward buying. The Stochastic Oscillator indicates a sell signal, showing that short-term overbought pressure has been somewhat relieved; similarly, the MACD also suggests a sell signal, implying that momentum may weaken. However, other indicators like the Ichimoku Cloud and Bollinger Bands are signaling buy opportunities, reflecting that prices could be near the lower boundary of a range or at a turning point in the trend. Moreover, the VR volume ratio indicator shows a buy signal, indicating relatively positive fund inflows. The RSI is at 57, in the neutral zone; both the CCI and Williams %R indicators remain neutral, showing that market sentiment hasn't become extreme. A comprehensive summary of technical indicators gives a 'buy' signal with a strength of 8, suggesting that although some indicators lean bearish, most tools still support short-term rebound opportunities.
Regarding key price levels, the first support is set at 100.1 yuan, which is close to the 30-day moving average. If broken, it may test the second support at 95.6 yuan, near the 60-day moving average and previous significant lows. On the upside, the first resistance is at 108 yuan, and a break above could lead to testing the second resistance at 112.1 yuan. The stock is currently hovering around 102 yuan, in a critical battle zone between support and resistance. The 5-day volatility is 6.7%, indicating increased fluctuations and potential short-term trading opportunities. The probability of an upward move is 54%, slightly above the neutral level, suggesting a mild bullish bias from a technical perspective.
In summary, although BYD's short-term trend faces adjustment pressure, the technical structure hasn’t completely turned bearish. The share price has dropped below the 10-day moving average but holds above longer-term averages, indicating resilience in the medium-term trend. Although there are conflicting technical signals, overall buy signal strength is higher, supported by potential buying power near key supports. If the stock can stabilize above 100.1 yuan in the short term, a rebound opportunity is worth watching. Investors should closely monitor changes in trading volume and whether the stock can reclaim the 10-day moving average to confirm a recovery in momentum. Based on a comprehensive analysis, the current technical outlook shows a buy signal. It’s recommended that investors consider gradually building positions near support levels, using a breach of the second support as a stop-loss reference, targeting resistance levels in the range of 108 to 112.1 yuan.


Following the mention on March 31, 2026, BYD's (01211) stock price cumulatively dropped by 1.80% over the next two trading days; correspondingly, bearish derivative products recorded positive returns: $HS#BYD RP2812C.P (55210.HK)$ The cumulative increase over the two days reached 18%, $JP#BYD RP2808D.P (62446.HK)$ with a cumulative rise of 14%; put warrant products also showed steady performance, $UB-BYD @EP2611A.P (24648.HK)$ with a cumulative rise of 10%, $JP-BYD @EP2611A.P (27598.HK)$ and a cumulative rise of 9%, fully demonstrating the return characteristics of inverse leverage products in a downward market.

For investors who are optimistic about the future market and believe that the stock price can break through resistance, they may consider $BI-BYD @EC2606A.C (22525.HK)$ , with an exercise price of 116.98 yuan. Although it is slightly out-of-the-money, its premium and implied volatility are the lowest among similar products, effectively reducing the cost of time value erosion, making it suitable for precise breakout strategies. Another option is $HS-BYD @EC2606A.C (22510.HK)$ , also with an exercise price of 116.98 yuan, offering relatively higher leverage, which amplifies potential returns.
For investors who are bearish on the future market and expect the stock price to retest the support level, $HS-BYD @EP2606A.P (18730.HK)$ and $BI-BYD @EP2606A.P (17485.HK)$ both options are attractive, with exercise prices around 100.78 and 100.88 yuan respectively, close to key support levels, and both offering higher leverage and the lowest implied volatility among put warrants, effectively hedging downside risks. For those looking to execute directional trades using bull/bear certificates, on the bull certificate side, $BI#BYD RC2612F.C (54686.HK)$ The call price is 99.8 yuan, which is approximately 4% away from the current price, offering relatively higher leverage. $UB#BYD RC2608G.C (60363.HK)$ The call price has been further lowered to 97 yuan, providing an even more sufficient safety margin. Regarding bear contracts, UBS Group’s bear contract (69184) has a call price of 116.5 yuan, with the lowest premium and relatively high actual leverage. $JP#BYD RP2808D.P (62446.HK)$ The call price is set at 119 yuan, offering the highest actual leverage among similar products, suitable for investors who are bearish and can tolerate higher risks. When choosing, it is essential to pay attention to the recovery risk of bull/bear contracts and the time value erosion of warrants.

BYD's current share price is holding above the 30-day moving average. Do you think the support at this level is strong enough? If BYD falls to the second support level of 95.6 yuan, would you consider adding to your position?
Feel free to share your insights in the comment section. For more market analysis, please continue following ‘Hong Kong Stock Warrants Jenny’ for daily updates!
Reminder: This article does not constitute any investment advice.
This article is for reference only and does not constitute any investment advice. The market data, opinions, and analysis contained herein may change at any time without prior notice. We are not responsible for any loss or damage caused by reliance on the information in this article. Technical analysis only shows whether certain technical conditions are met; a comprehensive assessment of asset performance should be conducted using additional data. Decisions to trade should not be based solely on this article. Please note that past performance is not indicative of future results.
#HongKongStocks #RealTimeAnalysis #WarrantsSelection #WarrantsStrategy #DerivativesHedging #HongKongWarrantsJenny #BYD #01211 #AutomobileStocks$Hang Seng Index (800000.HK)$$Hang Seng TECH Index (800700.HK)$
Risk Disclaimer: The above content only represents the author's view. It does not represent any position or investment advice of Futu. Futu makes no representation or warranty.Read more


Comments
to post a comment
3
1