After a 15% surge, Huahong Semiconductor faces resistance at higher levels. Is it a short-term breakout or a pullback?
$HUA HONG SEMI (01347.HK)$ Following yesterday’s nearly 15% surge, the stock attempted another short-term rally today, peaking intraday at 94.2 yuan. It later encountered resistance at high levels, with gains narrowing to just 0.22%, and is currently trading at 91.2 yuan. Notably, its cumulative volatility over the past five trading days reached 18.2%, showing a significant increase in short-term fluctuations, indicating an intense tug-of-war between bulls and bears around key price levels.
On the news front, Daiwa raised its target price for Huahong Semiconductor from 110.00 yuan to 116.00 yuan. In terms of trend and moving averages, Huahong's share price has successively broken through the 10-day moving average (84.69 yuan) and the 30-day moving average (89.42 yuan), offering preliminary support for the short-term trend, reflecting a gradual recovery in recent buying momentum. However, the share price remains constrained below the 60-day moving average (96.03 yuan), which forms the most critical resistance for upward movement. The technical picture shows a 'short-term bullish but mid-term blocked' pattern: while short-term momentum is strong, the mid-term trend has yet to fully reverse. A decisive break above the 96-yuan level is needed to open up broader upside potential.
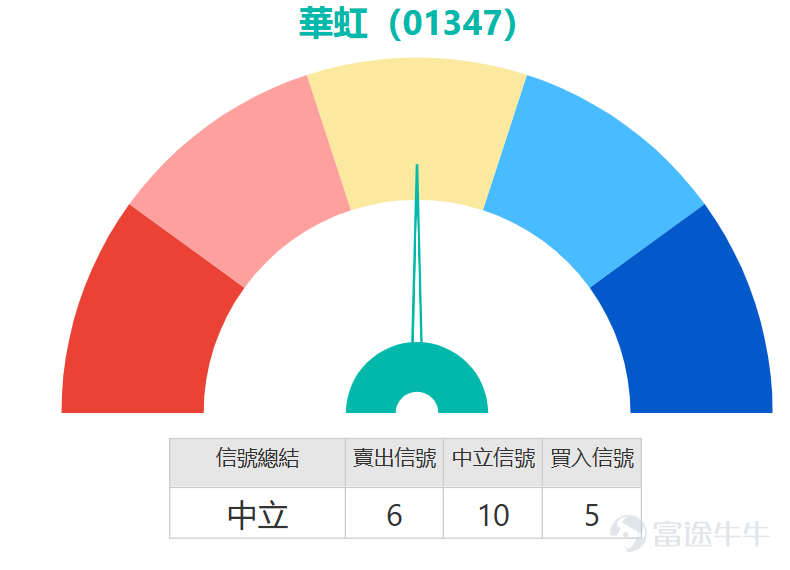
An in-depth analysis of technical indicators reveals that the stochastic oscillator has entered the overbought zone and issued a sell signal—a clear short-term warning suggesting the possibility of a technical pullback or consolidation pressure after the sharp price rise. Indicators such as the Commodity Channel Index (CCI), Relative Strength Index (RSI), and Williams %R remain neutral, providing no explicit directional guidance, reflecting that market momentum hasn’t yet entered an extreme one-sided state. However, there are positive signs amid divergences: the Volume Ratio (VR), Moving Average Convergence Divergence (MACD), and Bollinger Bands all signal a buy, hinting that medium-term capital flow and price momentum are quietly strengthening. Overall, technical indicators present a “neutral” summary signal with a strength rating of 10, accurately capturing the current equilibrium between bulls and bears, with direction undecided.
In terms of key price levels, the primary support lies at 84.6 yuan, with secondary support at 80.7 yuan; the main resistance is at 98.3 yuan, with stronger resistance at 103.9 yuan. The stock is currently in the central range between primary support and resistance. If bulls manage to push through the 98.3-yuan resistance, the outlook could extend towards testing 103.9 yuan and confirming a strengthening trend. Conversely, if bears push the price below the 84.6-yuan support, a deeper correction may ensue, potentially probing the 80.7-yuan level.
In conclusion, Huahong Semiconductor’s current technical chart reflects a 'short-term rebound facing resistance, mixed bull-bear signals' scenario. Although the share price has moved off recent lows and reclaimed the 10-day moving average, it now faces dual pressure from mid-to-long-term moving averages and the 98.3-yuan resistance level. Contradictions between the stochastic overbought condition and buy signals from multiple momentum indicators reflect growing market divergence at this juncture. For professional investors, this is not an ideal time to chase gains but rather to focus on range-trading opportunities. A more prudent strategy would be to wait for the market to make a directional choice: if the share price can break through 98.3 yuan with strong volume and stabilize above the 60-day moving average, short-term upside potential may open up, allowing for a follow-up trade. On the other hand, if the share price retreats from current resistance levels and breaks below the 84.6-yuan support, it could dip again to seek support. Until a clear signal emerges, range-bound trading or staying on the sidelines is the more cautious approach.


After Huahong's sharp rise the previous day, the street volume of call warrants dropped from 391.24 million units to 381.2 million units, a decrease of approximately 2.57%. The corresponding put warrant street volume increased from 50.91 million units to 54.67 million units, an increase of about 7.39%, indicating that the overall warrant market is leaning towards caution, with some funds starting to lay out short hedges. In terms of bull and bear certificates, the street volume of bull certificates decreased from 36.86 million units to 31.79 million units, a drop of around 13.75%. Meanwhile, the street volume of bear certificates rose from 19.44 million units to 21.46 million units, an increase of approximately 10.39%, consistent with the trend in the warrant market. This shows that short-term bullish funds have a strong intention to take profits, while demand for short hedging is also rising, leading to increased expectations for future market volatility in the derivatives market.
Looking back at March 31, when mentioning the cumulative rise of 2.19% in Huahong Semiconductor's underlying stock over the last two trading days, related derivative products recorded positive returns accordingly: $MSHUAHO@EC2607A.C (20092.HK)$ Cumulative increase of 7% over two days, $BIHUAHO@EC2608A.C (21730.HK)$ Cumulative increase of 5%; the elasticity of bull certificate products was more significant, $SG#HUAHORC2608D.C (65772.HK)$ With a cumulative increase of up to 35%, $UB#HUAHORC2607O.C (66424.HK)$ And a cumulative increase of 20%, highlighting the return elasticity feature of leveraged products during price fluctuations of the underlying asset.

For call warrants, $HSHUAHO@EC2606B.C (21238.HK)$ Offering about 5.7 times leverage with a strike price of 98.47 yuan, its premium and implied volatility are the lowest among similar products, making it suitable for investors who are optimistic about the future market and wish to deploy positions at a lower cost. Another option is $CIHUAHO@EC2606C.C (16665.HK)$ , with a strike price of 99.88 yuan and leverage of about 5.4 times, offering relatively low premiums and balancing costs with potential returns.
As for put warrants, $BIHUAHO@EP2607C.P (25020.HK)$ With a strike price of 88 yuan and leverage of about 3.2 times, it also has the lowest premium and implied volatility, making it suitable for defensive deployment by those who are bearish on the future market and seeking low-cost options. $JPHUAHO@EP2611A.P (25358.HK)$ With a strike price of 89.95 yuan and leverage of about 1.8 times, its leverage and implied volatility levels are relatively ideal, providing another choice for bearish investors.
Among the bull contracts products, $UB#HUAHORC2607N.C (65160.HK)$The call price is $76, with an actual leverage of about 4.8 times. The premium is the lowest among similar products, and the actual leverage is relatively higher, making it suitable for investors who are optimistic and wish to effectively control premiums.$BI#HUAHORC2612A.C (65970.HK)$The call price is $77.2, with an actual leverage of about 5 times. The leverage ratio is relatively high, which can amplify gains when the underlying stock rises.
In terms of bear certificates,$JP#HUAHORP2809A.P (69010.HK)$The call price is $100, with an actual leverage of about 10.5 times, representing the highest actual leverage option with a lower premium, making it suitable for investors who are bearish and seek high leverage.$UB#HUAHORP2812K.P (69108.HK)$The call price is also $100, with an actual leverage of about 10.8 times. It has the lowest premium and relatively high actual leverage, providing a cost-effective tool for those expecting a bearish market.

Do you think the semiconductor sector’s performance can support Hua Hong's trend movement going forward? Currently, both put warrants and bear contracts are seeing increased positions. Do you think this is a warning signal for a potential market pullback?
Feel free to share your insights in the comment section. For more market analysis, stay tuned to 'HK Stock Warrants Jenny' for daily updates! $Hang Seng Index (800000.HK)$$Hang Seng TECH Index (800700.HK)$$Semiconductors (LIST1013.HK)$
Reminder: This article does not constitute any investment advice.
This article is for reference only and does not constitute any investment advice. The market data, opinions, and analysis contained herein may change at any time without prior notice. We are not responsible for any loss or damage caused by reliance on the information in this article. Technical analysis only shows whether certain technical conditions are met; a comprehensive assessment of asset performance should be conducted using additional data. Decisions to trade should not be based solely on this article. Please note that past performance is not indicative of future results.
#HKStocks #RealTimeAnalysis #WarrantPick #WarrantGuide #DerivativesHedging #HKWarrantsJenny #HuaHong #01347 #ChipStock
Risk Disclaimer: The above content only represents the author's view. It does not represent any position or investment advice of Futu. Futu makes no representation or warranty.Read more
Comments
to post a comment