
Tencent (00700) Technical Outlook Improves: Can the Short-term Rebound Continue?
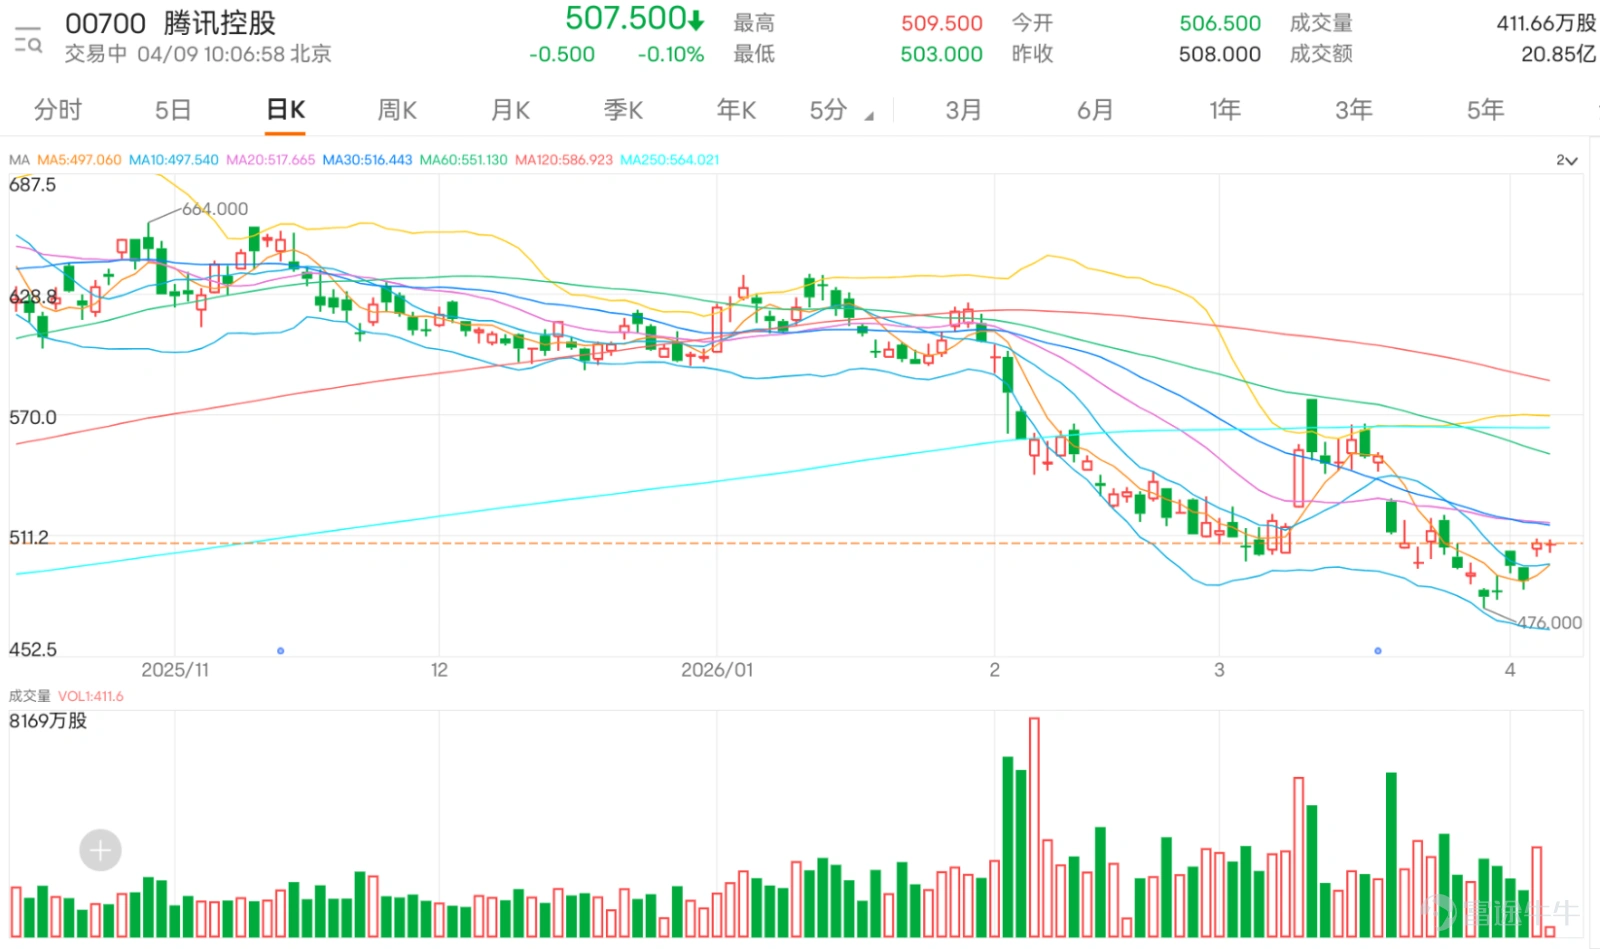
$TENCENT (00700.HK)$ After experiencing earlier market volatility, clear short-term bottoming signals have emerged in the current trend. In the previous trading session, the stock price surged by 3.84% in a single day, closing at HKD 508, with corresponding trading volume significantly increasing to HKD 16.614 billion, showing strong price-volume coordination. This reflects a notable rise in market attention on the stock. Today's trading shows a tug-of-war between buyers and sellers, with the stock price oscillating narrowly between HKD 503 and HKD 509.5. Over the past five trading days, the cumulative price fluctuation has reached 6.7%, indicating fierce short-term battles between bulls and bears. However, the price has stabilized and rebounded from its lows, gradually approaching a key resistance zone. Overall, Tencent has entered a short-term upward channel with technical indicators gradually strengthening. Investors should closely monitor subsequent trend developments.
In terms of moving average analysis, Tencent’s current price has successfully broken above the 10-day moving average (MA10: HKD 496.63), indicating a strengthening of short-term momentum. However, it still faces pressure from the 30-day moving average (MA30: HKD 517.46) and the 60-day moving average (MA60: HKD 553.08). Notably, the 60-day moving average at HKD 553.08 is close to Resistance Level 2 at HKD 564, meaning that the medium- to long-term trend has not fully reversed. If the stock price can consistently stay above MA10 and further break through MA30, the short-term rebound potential could open up. Conversely, if it falls below MA10, it may retest lower support levels. The current entangled state of the moving averages suggests an impending directional decision.
Observing key technical signals, the stochastic oscillator has issued a buy signal, suggesting the stock may have entered an oversold rebound phase. Other indicators are mostly neutral; for example, the RSI indicator is at 45, leaning towards neutral but slightly weak, while the CCI indicator also remains neutral, showing that the trend momentum has yet to be fully confirmed. However, the bull-bear strength indicator suggests 'oversold, possible bottoming, buy,' and the Ichimoku Cloud also issues a buy signal, supporting the view of a short-term rebound. On the other hand, MACD, Bollinger Bands, and VR trading ratio indicators show sell signals, reflecting continued medium- to long-term pressure. Overall, the combined technical indicators suggest a 'buy' signal with a strength of 8, indicating a reliable buy signal, though caution is warranted due to potential fluctuations from conflicting indicators.
Support and resistance level analysis shows that Tencent’s key support levels are at HKD 487 (Support 1) and HKD 452 (Support 2), while resistance levels are at HKD 535 (Resistance 1) and HKD 564 (Resistance 2). The current stock price is above Support 1 and moving towards Resistance 1. A breakout above HKD 535 could lead to a test of HKD 564. Conversely, a drop below HKD 487 could see a move down to the strong support area at HKD 452. With a 56% probability of an upward move, the short-term outlook leans optimistic, but significant selling pressure is expected near the resistance levels.
Based on the above analysis, Tencent shows a short-term buy signal for the following reasons: First, the stock price broke above MA10 with a significant daily gain, accompanied by increased trading volume, reflecting capital inflow. Second, both the stochastic oscillator and bull-bear strength indicators suggest an oversold rebound opportunity, with a relatively strong technical summary signal. Lastly, the price stabilized above the key support level of HKD 487, with a greater than 50% chance of moving higher, making a short-term rebound more likely. However, investors should note that indicators like MACD still show sell signals, and there is heavy resistance from upper moving averages. It is recommended to focus on short-term operations with strict stop-losses set below support levels, while monitoring the breakout at resistance level HKD 535. Overall, Tencent’s short-term technical outlook has improved, but more signals are needed to confirm the medium- to long-term trend. Professional investors may consider strategically positioning for a short-term rebound while closely monitoring market changes.

Tencent tested HKD 510 yesterday, with derivative product street volumes showing divergent trends. Call warrant street volumes slightly declined from 10,567.58 million contracts on April 2 to 10,562.51 million contracts on April 8, a decrease of approximately 0.05%. Meanwhile, put warrant street volumes saw noticeable growth, rising from 222.07 million contracts to 241 million contracts, an increase of about 8.52%. Bull certificate street volumes rose moderately from 796.66 million contracts to 802.76 million contracts, an increase of about 0.77%. Bear certificate street volumes also recorded a significant rise, increasing from 172.36 million contracts to 182.97 million contracts, an increase of about 6.16%.
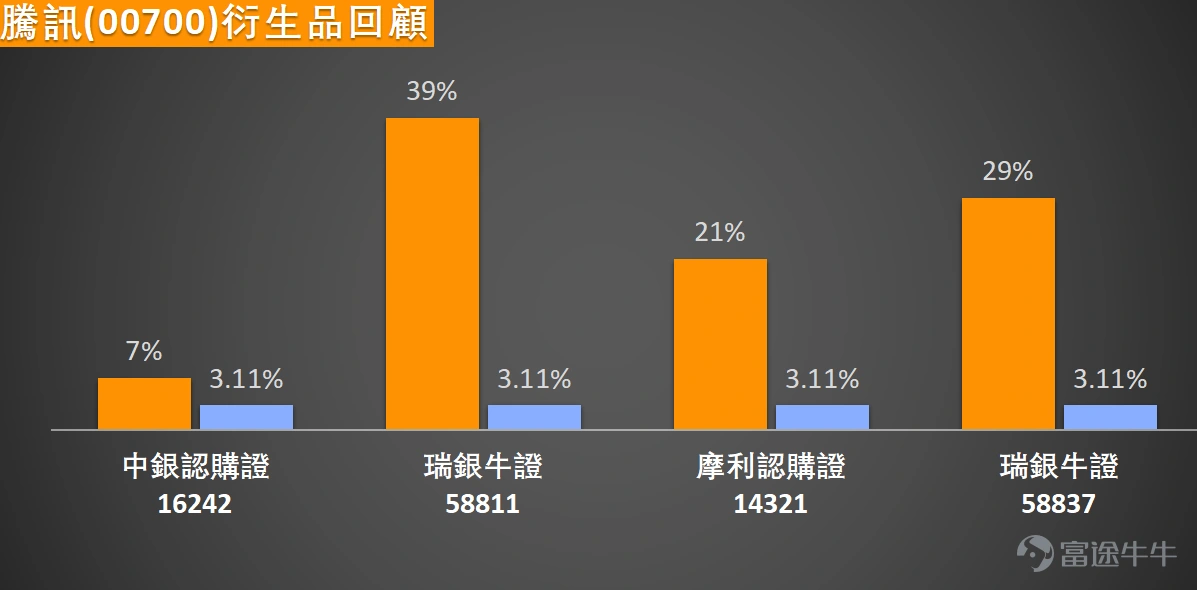
Looking back at the two trading days after March 30, Tencent's stock price strengthened overall, with a cumulative increase of 3.11% over two days, driving generally positive returns for related warrant products. $BITENCT@EC2606B.C (16242.HK)$ The two-day increase was 7%, $MSTENCT@EC2606A.C (14321.HK)$ with gains reaching 21%; two UBS Group bull contracts performed even more prominently, $UB#TENCTRC2607A.C (58811.HK)$and$UB#TENCTRC2607U.C (58837.HK)$ with increases reaching 39% and 29%, respectively.
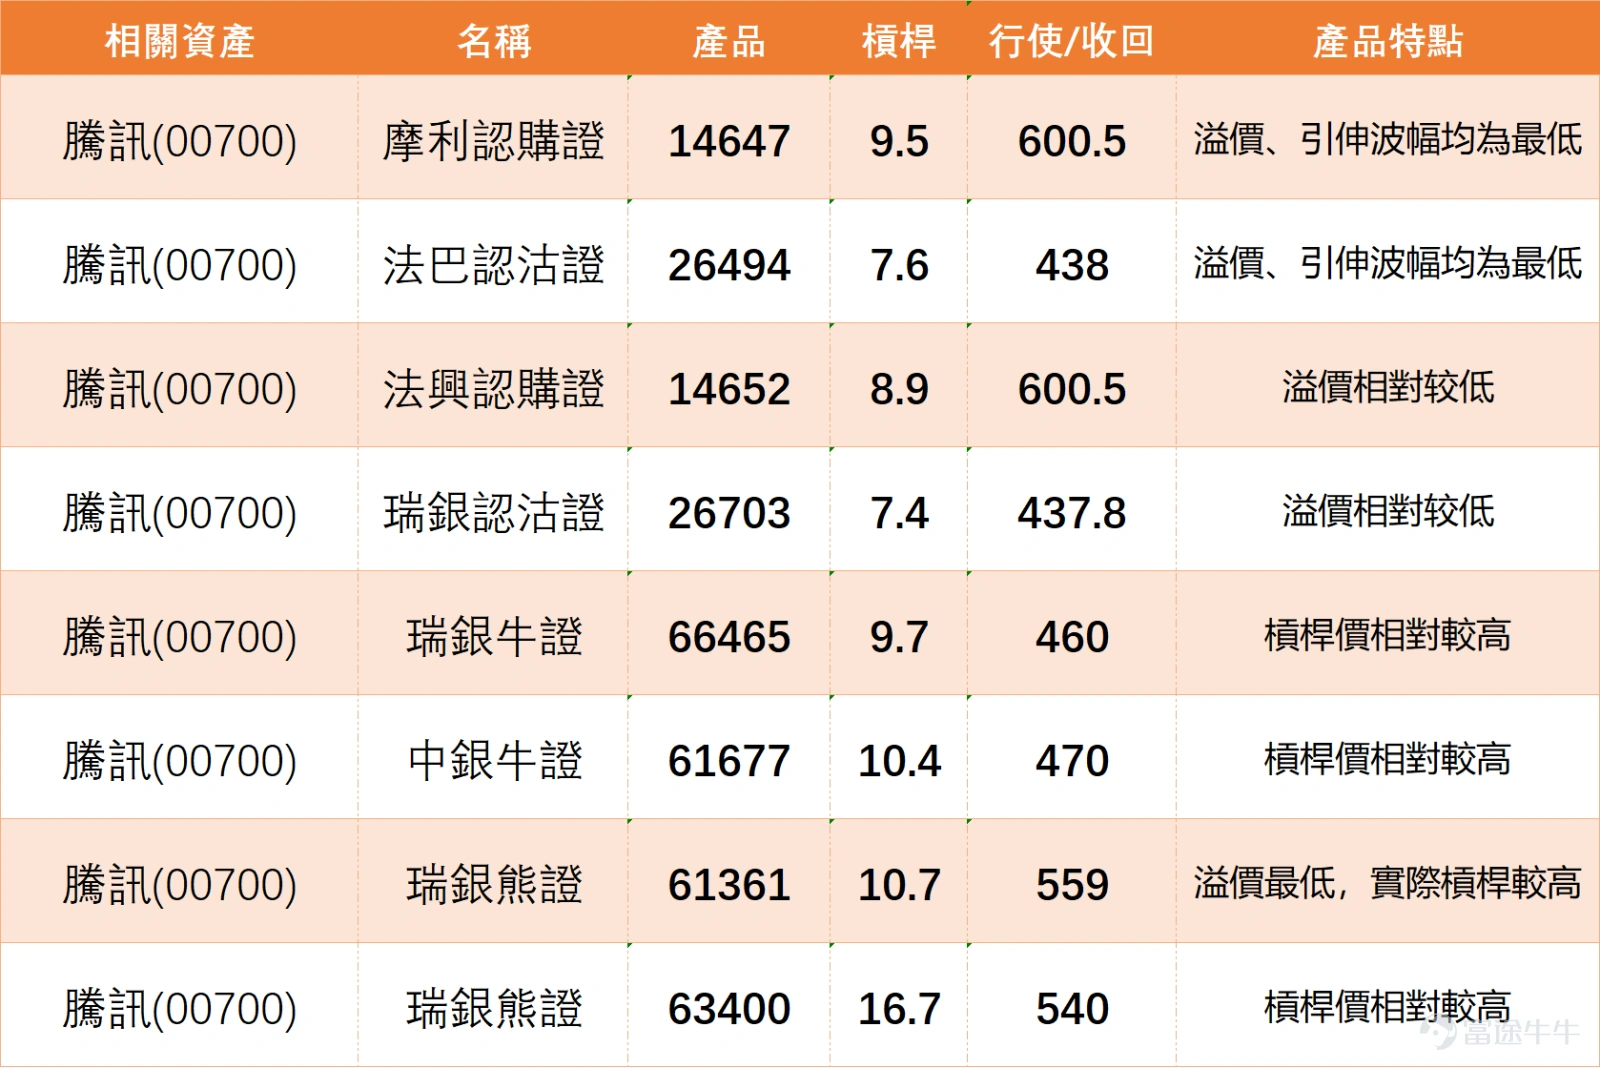
For investors optimistic about a short-term rebound in Tencent continuing, they may consider out-of-the-money call warrants that offer relatively moderate premiums, low implied volatility, and cost efficiency, such as $MSTENCT@EC2609A.C (14647.HK)$ , with a strike price of 600.5 yuan, providing approximately 9.5 times actual leverage. Its low premium and low implied volatility characteristics allow it to more effectively track the underlying stock when the direction is correctly predicted. Another option $SGTENCT@EC2609A.C (14652.HK)$ , also with a strike price of 600.5 yuan, offers leverage of about 8.9 times, with relatively low premium as well, providing another cost-effective way to participate in the rebound.
If the rebound is expected to stall and the stock price moves down to test support levels again, put warrants could be deployed as a hedge or bearish strategy. $BPTENCT@EP2609A.P (26494.HK)$ With a strike price of 438 yuan, and $UBTENCT@EP2608C.P (26703.HK)$ a strike price of 437.8 yuan, both have relatively lower implied volatility and premium compared to other market options, reducing the impact of time decay and volatility erosion, making them more efficient in capturing potential downside movements.
In terms of bull and bear certificates, their price movements are typically more closely correlated with the underlying stock and do not suffer from time decay, making them suitable for short-term directional trading. Investors who are optimistic may pay attention to $UB#TENCTRC2608O.C (66465.HK)$ , with a recovery price of 460 yuan, offering approximately 9.7x leverage; or $BI#TENCTRC2612Q.C (61677.HK)$ , with a recovery price of 470 yuan, providing slightly higher leverage of about 10.4x. Both options have relatively high leverage ratios, amplifying potential rebound gains. For those who are bearish, consider $UB#TENCTRP2812S.P (61361.HK)$ , with a recovery price of 559 yuan, which has the lowest premium among similar products, and an actual leverage of around 10.7x, making it a highly efficient choice. As for extremely aggressive investors, they might consider $UB#TENCTRP2812V.P (63400.HK)$ , with a recovery price of 540 yuan, offering as much as 16.7x leverage, showing extremely high sensitivity to stock price declines. However, note that its recovery price is relatively close to the current price, meaning a higher risk of being called back. Investors should choose suitable products based on their own risk tolerance and market judgment.
If Tencent subsequently retraces to the 10-day moving average, do you think it would be a good short-term entry point? What fundamental signals, in addition to technical indicators, do you believe are needed for Tencent to reverse its medium- to long-term trend? Feel free to share your thoughts in the comments section. For more market analysis, stay tuned to Jenny's daily updates on 'HK Stock Warrants'!
Reminder: This article does not constitute any investment advice.
This article is for reference only and does not constitute any investment advice. The market data, opinions, and analysis contained herein may change at any time without prior notice. We are not responsible for any loss or damage caused by reliance on the information in this article. Technical analysis only shows whether certain technical conditions are met; a comprehensive assessment of asset performance should be conducted using additional data. Decisions to trade should not be based solely on this article. Please note that past performance is not indicative of future results.
#HKStocks #RealTimeAnalysis #WarrantPick #WarrantGuide #DerivativesHedging #HKWarrantsJenny #Tencent #00700 #TechStocks$Hang Seng Index (800000.HK)$$Hang Seng TECH Index (800700.HK)$
Risk Disclaimer: The above content only represents the author's view. It does not represent any position or investment advice of Futu. Futu makes no representation or warranty.Read more

Comments
to post a comment
4
1