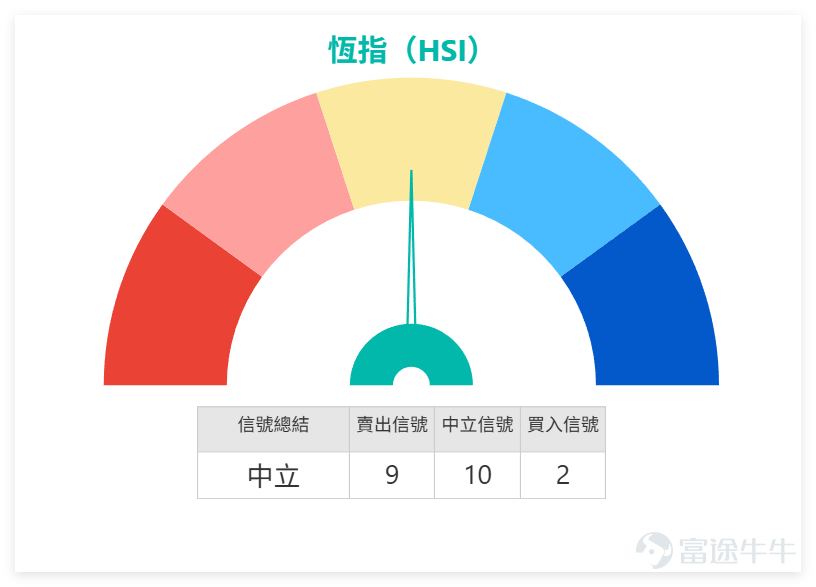

The technical outlook for the Hang Seng Index is "neutral," with coexisting rebound momentum and overbought pressure.
On the previous day (April 8th) $Hang Seng Index (800000.HK)$
The index closed at 25,893.02 points, surging 3.09% in a single day, with a trading volume of 372.437 billion yuan, indicating active liquidity.
Support and resistance levels: Support 2 at 24,628 points, Support 1 at 25,175 points, Resistance 1 at 26,290 points, Resistance 2 at 27,158 points, with a 54% probability of an upward move and a 5-day volatility of 5.9%.
The Hang Seng Index RSI is at 54, within the neutral range; the overall technical indicator summary signal is neutral, with a signal strength of 10; multiple oscillation indicators show neutrality, the Williams %R indicator suggests an overbought condition but provides a neutral signal, the stochastic oscillator indicates an overbought state and a sell signal, the MACD signal is buy, Bollinger Bands are stable, and the overall situation reflects a phase where both rebound continuation and profit-taking pressures coexist.

Blue chips generally rose on April 8th, with clear divergence in gains, and technical signals showing "tripolar divergence." The breakdown is as follows:
(1) Rebound potential stocks (received buy signals)
1. Tencent (00700): Closing price at HKD 508, up 3.84% in a single day; closing price higher than MA10 (HKD 496.63), but lower than MA30 (HKD 517.46) and MA60 (HKD 553.08); RSI is 45 (neutral). Technical indicators suggest a buy signal (signal strength 8), multiple oscillation indicators hint at oversold conditions forming a bottom, with rebound momentum accumulating.
2. Alibaba (09988): Closing price at HKD 126.5, surged 6.75% in a single day; closing price higher than MA10 (HKD 122.46), but lower than MA30 (HKD 131.29) and MA60 (HKD 145.80); RSI is 41 (slightly neutral to low), technical indicators suggest a strong buy signal (signal strength 9), oscillation indicators point to severe oversold conditions, indicating strong demand for technical rebound.
(2) Overbought Risk Stocks (Sell Signal Received)
1. China Construction Bank (00939): Closing price at HKD 8.51, slightly up 0.71% in a single day; closing price above MA10 (HKD 8.19), MA30 (HKD 8.05), and MA60 (HKD 7.95), maintaining a bullish alignment; RSI is 65 (overbought zone), technical indicators suggest a sell signal (signal strength 8), oscillation indicators point to overbought conditions, with clear pressure for profit-taking.
2. China Mobile (00941): Closing price at HKD 80.95, slightly up 1.12% in a single day; closing price higher than MA10 (HKD 78.72) and MA30 (HKD 78.99), but lower than MA60 (HKD 79.28); RSI is 63 (overbought zone), technical indicators suggest a sell signal (signal strength 9), oscillation indicators point to overbought conditions and selling signals, with clear risk warnings.
3. HSBC Holdings (00005): Closing price at HKD 138.6, surged 6.62% in a single day; closing price above MA10 (HKD 126.54), MA30 (HKD 130.76), and MA60 (HKD 131.71); RSI is 61 (overbought zone), technical indicators suggest a sell signal (signal strength 8), oscillation indicators point to overbought conditions, with a large short-term increase.
4. Meituan (03690): Closing price at HKD 88.5, surged 10.28% in a single day; closing price above MA10 (HKD 83.6), MA30 (HKD 80.43), and MA60 (HKD 87.81); RSI is 54 (moderately strong), technical indicators suggest a sell signal (signal strength 9), oscillation indicators point to overbought conditions, increasing pressure for profit-taking after a rapid rise.
(3) Cautiously observed targets (received neutral signal)
1. Hong Kong Exchange (00388): Closing price at HKD 412.4, up 4.14% in a single day; closing price above MA10 (HKD 393.3) and MA30 (HKD 403.65), but lower than MA60 (HKD 414.05); RSI is 55 (moderately strong), technical indicators suggest a neutral signal (signal strength 9), questioning the sustainability after a short-term surge.
2. AIA (01299): Closing price at HKD 88.65, up 2.90% in a single day; closing price above MA10 (HKD 85.6), MA30 (HKD 84.8), and MA60 (HKD 85.01); RSI is 57 (moderately strong), technical indicators suggest a neutral signal (signal strength 9), with significant short-term gains increasing pressure for profit-taking.
3. Ping An (02318): Closing price at HKD 62.4, up 3.65% in a single day; closing price is higher than MA10 (HKD 59.65), but lower than MA30 (HKD 63.29) and MA60 (HKD 66.78); RSI is 50 (neutral). Technical indicators show a neutral signal (signal strength 10), short-term trend remains unclear.
4. Xiaomi Group (01810): Closing price at HKD 32.76, surged 6.09% in a single day; closing price is higher than MA10 (HKD 32.25), but lower than MA30 (HKD 33.51) and MA60 (HKD 34.90); RSI is 43 (neutral). Technical indicators show a neutral signal (signal strength 8), sustainability after the sharp rise needs to be observed.
Review and Selection of Hang Seng Index Warrants and Bull/Bear Contracts
(1) Review of Previous Products
Reviewing the Hang Seng Index-related CBBCs and bull/bear products recommended on March 30, they delivered impressive performance: BOC Bull Certificate (55890) rose 54% within 2 days, BOC Bull Certificate (55493) increased by 46%, J.P. Morgan Call Warrant (23979) gained 13%, and UBS Group Call Warrant (24012) climbed 12%. All followed the rebound of the Hang Seng Index, achieving solid leveraged returns in line with market momentum.
(II) Hang Seng Index Warrant Selection:
Considering the strong performance of the Hang Seng Index and divergence in technical factors, two selected products suitable for different trading strategies are recommended for investors' reference, balancing risks and potential opportunities.
1. UBS Group call warrant for Hang Seng Index (24012): Leverage 17.6, strike price 27,738; the lowest implied volatility and higher leverage make it suitable for investors optimistic about the Hang Seng Index moving towards the resistance level.
2. Hang Seng Index J.P. Morgan Put Warrant (23956): Leverage of 11.7, strike price 24,400, lowest premium, implied volatility and leverage both relatively ideal, suitable for investors concerned about the correction risks following an overbought Hang Seng Index.
Risk Warning: The Hang Seng Index and several blue-chip stocks showed overbought signals yesterday. The market is currently in a phase where rebound momentum coexists with profit-taking pressure. Wheel warrants are experiencing significant volatility. Investors should assess their risk tolerance, rationally manage positions, and closely monitor changes in support/resistance levels and trading volumes of the Hang Seng Index.
The Hang Seng Index surged 3% yesterday. Do you think it will continue to test the resistance at 26,290? A. Yes B. No.
Feel free to share your insights in the comments section.
Reminder: This article does not constitute any investment advice.
This article is for reference only and does not constitute any investment advice. The market data, opinions, and analysis contained herein may change at any time without prior notice. We are not responsible for any loss or damage caused by reliance on the information in this article. Technical analysis only shows whether certain technical conditions are met; a comprehensive assessment of asset performance should be conducted using additional data. Decisions to trade should not be based solely on this article. Please note that past performance is not indicative of future results.
#HongKongStocks #HangSengIndex #Real-TimeAnalysis #WarrantSelection #WarrantGuide #DerivativesHedging #Blue-ChipStocks #TechnicalAnalysis
Risk Disclaimer: The above content only represents the author's view. It does not represent any position or investment advice of Futu. Futu makes no representation or warranty.Read more
Comments
to post a comment