
March Summary of the Crypto Market: US-Iran-Israel War Causes Continued Tightening of Global Financial Conditions, BTC 'Deep Bear Market' Continues to Clear Silently | Bitcoin | Deep Bear Market | Research Report | Cryptocurrency Market Analysis
In March, the US-Israel-Iran conflict disrupted global financial markets. Despite ongoing peace talks, the warring parties continued to escalate tensions. As the Strait of Hormuz neared 'closure' and refineries in Gulf states were bombed, crude oil futures surged to record highs, sharply increasing the probability of a second round of inflation post-pandemic.
Central banks around the world signaled close attention to inflation developments, adopting a tightening stance, as financial markets began pricing in the scenario of no rate cuts for the year, or even potential interest rate hikes.
With tighter interest rate expectations, financial markets came under sudden pressure, causing significant declines in the three major U.S. stock indexes and gold. After five consecutive months of decline and a relatively thorough adjustment, $Bitcoin (BTC.CC)$ however, was supported by DAT Company's buying power, holding up against the pressure to achieve a small increase.
Nevertheless, the situation within the crypto market remains severe, with investors continuing to sell at a loss, and liquidity further deteriorating. This situation is no different from previous cycles.
We believe that the most severe crisis moment for both the global financial market and the crypto market has yet to come this year.
Macroeconomic Finance: Escalation in the Strait of Hormuz, continued tightening of global financial conditions.
The most critical variable in the global macro-financial markets in March was not a sudden collapse in economic data itself, but rather the rise in energy prices driven by Middle East conflicts, pushing inflation, which had not been fully tamed, back to the center of market pricing. The Federal Reserve clearly maintained the federal funds rate unchanged at the March FOMC meeting, pointing out that 'inflation remains high' and 'economic uncertainty remains elevated,' with particular mention of the uncertain impact of the Middle East situation on the U.S. economy, maintaining a hawkish stance. The European Central Bank (ECB) also chose to stay put in March, emphasizing that the war brings upward inflation risks and downward growth risks; the Bank of Japan (BOJ) continued its statement that 'if the economy and inflation evolve as expected, it will continue to raise interest rates and adjust monetary easing.'
Against this backdrop, the Fed, ECB, and BOJ are finding it harder to tilt toward interest rate easing. While a full contraction in liquidity has not yet occurred in global markets, they have officially entered a phase of pricing 'tightening financial conditions + fragile risk appetite.' This change directly alters the pricing framework for risky assets.
First, let's look at the economic fundamentals.
In March, the U.S. announced Q4 2025 GDP and February 2026 retail sales. The annualized real GDP growth for Q4 2025 came in at 1.4%, significantly lower than the 4.4% in Q3, indicating that the U.S. economy has slowed from strong expansion to moderate growth. Meanwhile, February retail sales grew 0.6% month-on-month and 3.7% year-on-year, recovering somewhat from a revised 0.1% drop in January, showing that consumption has not collapsed but is also not re-accelerating. This combination suggests that the economy has not fallen into recession, resilience remains but elasticity has weakened. In its latest outlook, the ECB lowered its Eurozone growth forecast for 2026 to 0.9% and explicitly pointed out that the war is dragging down growth through commodities, real income, and confidence channels. In other words, Europe has entered a typical structure of 'weak growth + recurring inflation.' China's official Manufacturing PMI rose to 50.4 in March, up significantly from 49.0 in February, while the Non-Manufacturing PMI rose to 50.1, indicating that China’s economy marginally recovered in March, but this recovery currently looks more like cyclical rebound and is not yet sufficient to offset global growth pressures caused by weak demand in Europe and America and energy shocks.
Thus, the true picture of global growth in March is not 'recession has arrived,' but that the U.S. is still expanding albeit at a notably slower pace; European growth is weaker and more vulnerable to secondary energy price shocks; China is marginally recovering but not yet strong enough to be the main engine driving global demand higher again. This pushes global asset pricing into a more uncomfortable range: growth isn’t bad enough to force central banks into easing, but is weak enough that it cannot absorb high discount rates.
Next, let's examine employment data.
U.S. non-farm payroll data released in early April showed an increase of 178,000 jobs in March, compared to a decrease of 133,000 in February; the unemployment rate fell from 4.4% to 4.3%, suggesting that the labor market has not entered a rapid deterioration phase. The Federal Reserve used very restrained language in its March statement: 'Economic activity is expanding at a solid pace, job growth remains low, unemployment has changed little in recent months, and inflation remains elevated.' The underlying policy implication is clear – employment conditions aren’t bad enough to warrant immediate interest rate cuts.
In other words, there wasn't a sufficiently strong 'bad news on growth/employment' in March to offset 'bad news on inflation and oil prices.' In macro trading terms, it was neither a typical recession trade nor a typical soft landing trade but instead closer to 'mild stagflation' pricing.
Finally, look at the inflation side.
The US February CPI was released on March 11: CPI increased by 2.4% year-over-year, core CPI increased by 2.5% year-over-year, and core CPI increased by 0.2% month-over-month. The data indicates that US core inflation continues to slowly decline. However, the market has not turned optimistic as the January PCE price index rebounded to 2.8% year-over-year, while the US-Iran war had not yet started at that time.
Driven by the Middle East conflict and risks related to the Strait of Hormuz, Brent crude oil futures prices recorded a historic single-month increase of 61.84% in March. Market forecasts for the average Brent crude oil price in 2026 were significantly revised upwards from $63.85 per barrel in February to $82.85 per barrel. The war will have a substantial impact on near-term inflation through higher energy prices.
March has turned into 'core inflation has not fully returned to target, with an energy shock raising inflation tail risks in the coming months.' Therefore, global markets are revisiting discussions in March: if oil prices remain high for weeks to months, will the path of core inflation's decline become rough again, or even see a second uptick? The macro narrative has shifted from 'delayed rate cuts' to 'mild stagflation.'
Considering the above factors, US stock indices underwent significant corrections in March, $S&P 500 Index (.SPX.US)$and$Nasdaq Composite Index (.IXIC.US)$ with declines reaching 5.09% and 4.75%. Gold plummeted by 11.27%. Due to prior sufficient declines and some buying power entering the market, Bitcoin, which had fallen for five consecutive months, $Bitcoin (BTC.CC)$ welcomed a small rebound in March, closing up by 1.87%.
The market outlook focuses on three key points:
Whether the US-Iran war can end quickly and whether oil prices can drop rapidly. This is the most important variable going forward. If oil prices remain high, overall global inflation over the next 1-3 months will face pressure, making it harder for central banks to signal easing.
Whether US core inflation can continue to decline. The 0.2% month-over-month increase in core CPI in February was good news, but the Fed has raised its full-year PCE and core PCE forecasts to 2.7%. More attention should be paid to whether the crisis in the Strait of Hormuz can be resolved soon; if it persists, the greatest risk is a resurgence of global secondary inflation, and some economies might even raise interest rates.
Whether the US job market is beginning to show a trend of weakening. If the unemployment rate stays above 4.4% and is accompanied by weak job growth, the Federal Reserve may shift towards a more dovish stance; otherwise, the current high interest rate environment will likely persist longer.
Crypto Market: Technical rebound after five months of decline
According to Coinbase data, this month $Bitcoin (BTC.CC)$ opened at $66,967.85, closed at $68,221.85, with a low of $64,938.66 and a high of $76,022.60; trading volume was significantly lower compared to last month. Amidst the escalating U.S.-Iran-Israel conflict and tightening macro financial conditions, $Bitcoin (BTC.CC)$ after five consecutive months of sharp declines, Bitcoin experienced an oversold rebound, ending the month up 1.87%.
This month’s BTC price movements were shaped by a combination of factors, including inflationary pressures triggered by the U.S.-Iran-Israel conflict, reduced risk appetite leading to repricing of long-duration assets, diminished selling pressure following prolonged steep declines, and temporary inflows from bargain hunters.
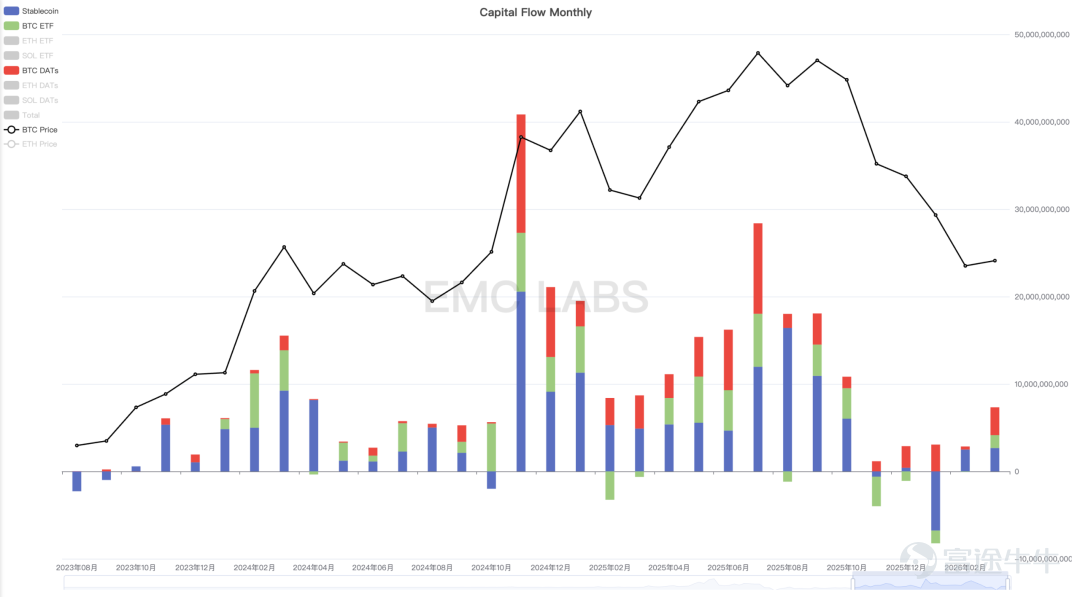
First, let's examine buying power. This month, corporate procurement, $Bitcoin (BTC.CC)$ ETFs, and stablecoin channels collectively brought in approximately $7.335 billion, with the largest inflow still coming from DAT company purchases, amounting to $3.184 billion, which is the highest monthly purchase volume since August last year, demonstrating the strong financial engineering capabilities and market financing prowess of DAT, particularly Strategy companies.

Monthly capital flows in the crypto market
Funds flowing through stablecoin channels mostly exhibited follow-up participation. The largest inflow day occurred on March 17. $Bitcoin (BTC.CC)$ The day after hitting a monthly high.

Statistics on the scale of stablecoin reserves in centralized exchanges.
Following this, the accompanying price decline quickly turned into outflows, showing a lack of independent will.
$Bitcoin (BTC.CC)$ Funds through the ETF channel showed an overall inflow in the first half of the month and an overall outflow in the second half. This behavior was more driven by inflation expectations caused by the war and fund flows triggered by adjustments in U.S. stocks.
The perpetual contract market as a whole showed signs of capital returning. Since the low point on March 1, it increased from an early-month low of $47.678 billion to $54.637 billion at the end of the month, indicating some recovery in trading enthusiasm, but still less than half of the peak. In terms of fees, the first half of the month saw negative rates, which turned positive in the second half, showing that extreme pessimism had somewhat subsided, with some recovery in bullish sentiment, though still at a relatively low level overall.
Overall, in terms of buying power this month, DAT companies increased their purchasing efforts, while Bitcoin and stablecoin funds followed a momentum-driven strategy, and although the futures market has recovered somewhat, trading remains sluggish, failing to provide momentum for one-way market movement.
Deep Bear Market: Calm, but undergoing deep liquidation.
Compared to the层出不穷 crises during the 2022 bear market, although the current crypto bear market has seen declines exceeding 50% at one point, the intensity and breadth of internal crises that have erupted are still smaller than those of the collapses of LUNA, Three Arrows Capital, and FTX back then. On one hand, this shows that industry resilience has improved; on the other hand, it raises suspicions that perhaps the most stressful moment has yet to come, and vulnerabilities have not been fully released.
According to the 'EMC Labs BTC Cycle Analysis Model', currently $Bitcoin (BTC.CC)$ we are in the middle to late stages of the downtrend (bear market), also known as the 'deep bear market' phase. The theme of market movement in this phase is the surrender-like exchange of loss-making positions — both long-term and short-term holders, especially single-cycle long-term holders who sell off their positions to cut losses due to unbearable significant losses.
According to eMerge OS statistics, a total of 785,160.27 Bitcoin flowed into exchanges in March, with sell-offs amounting to approximately $54.96 billion based on the average price this month. $Bitcoin (BTC.CC)$ In terms of profit and loss performance, long-term holders (LTH) realized cumulative profits of $344 million and cumulative losses of $798 million, resulting in a net monthly loss of $454 million. Short-term holders (STH) realized cumulative profits of $142 million and cumulative losses of $600 million, leading to a net monthly loss of $458 million. This statistical data aligns with the movement characteristics typical of 'deep bear markets' historically.

BTC On-chain Profit and Loss Ratio Statistics
As of March 31, $Bitcoin (BTC.CC)$ the on-chain realized profit-to-loss ratio is around 0.8, indicating that the current on-chain migration is primarily driven by losses. This ratio dropped below 1 in late February, signaling that losses have become the norm, and further declined in March, reflecting worsening loss conditions, though it remains far from the extreme value of 0.5 often seen during previous deep bear market bottoms.

LTH On-chain Unrealized Profit and Loss Statistics
As of March 31, the on-chain unrealized profit-to-loss ratio for long-term holders is 0.31, meaning that the long-term holder group still holds 31% in profits overall. Historically, at cyclical bear market bottoms, this figure often falls below 0, indicating that the entire long-term holder group is in a loss-making state. Currently, there is still considerable distance from this threshold. The liquidation of long-term holders is a crucial component of deep bear markets, and the current profit-to-loss ratio indicates that the 'deep bear market' has not yet reached its most devastating stage, as the scale and proportion of losses have yet to overwhelm the psychological defenses of numerous loss-bearing holders.
From the perspective of cyclical market dynamics, there are positive signals suggesting a transition phase in the cycle is occurring.
After three major distribution phases over the past three years, the long-term holder group is re-entering an accumulation phase. Over the 31 trading days in March, there were 24 days of accumulation and 7 days of distribution, with a total net accumulation of 107,826.80 Bitcoin, compared to a cumulative reduction of 42,375.15 Bitcoin. This phenomenon, where realized losses exceed realized profits while long-term holders accumulate significantly more than they reduce holdings, often occurs in the later stages of cyclical bear markets. The accumulation by long-term holders reduces the proportion of coins available for short-term trading, absorbs selling pressure in the market, and suggests that the 'deep bear market' might be transitioning towards a 'bottoming-out period.'

Long- and Short-Term Holder On-chain Position Statistics
Of course, according to the 'cycle law,' this absorption process is slow and accompanied by the continuous capitulation of weak hands (single-cycle longs) within the long-term group. Therefore, we consider these signs as nodes to observe the progress of the cycle rather than the optimal entry timing.
DAT's performance this cycle, especially during the downward phase, has been remarkable, with its sustained and substantial buying in March absorbing market selling pressure while keeping $Bitcoin (BTC.CC)$the price above $60,000 and injecting bullish confidence into the market. However, it should be noted that DAT has shown signs of divergence: the bullish leader Strategy purchased approximately 44,377 coins, while MARA Holdings, Exodus Movement, and others collectively sold over 22,000 coins, contributing to market clearing.
Conclusion
The surge in crude oil futures prices triggered by the Israel-Iran war, a key variable, pushed risk assets toward lower pricing and initiated a prolonged repricing process following the delayed rate cut cycle.
After a significant and prolonged decline, Bitcoin (BTC) has entered a phase of temporary equilibrium. During this period, the Israel-Iran conflict, the main variable, has temporarily taken control of BTC’s price movement once again.
However, within the four-year cycle framework, we observe that BTC continues to follow the 'cycle law' for rebalancing and market-clearing processes.
Regardless of whether the Israel-Iran war can be resolved in the short term, we cautiously predict that BTC will still complete the full four-year cycle movement process.
This implies that market clearing and vulnerability exposure will continue to dominate the mid-term trend, and perhaps BTC will not see the best allocation timing for cyclical bullish positions until two quarters later.
DAT’s notable accumulation and potential macro-financial shifts are viewed as prudent observation points. While they may alter the intensity of adjustments, they do not support the assertion that 'this time is different.'
The above analysis is provided by EMC Labs.
———————————————————————
About EMC Labs
EMC Labs is a partner of Victory Securities, and together they launched the only virtual asset fund approved by the SEC that accepts stablecoin subscriptions — the Victory EMC BTC Cycle Fund. EMC Labs was co-founded by experienced virtual asset investors and data scientists, with a core team from JD.com Finance, Bell Labs, Marsbit, and other companies. EMC Labs has invested substantial resources into building professional engines to analyze BTC on-chain data and technical indicators.
Disclaimer
Investing involves risks, and investors should be aware. The value of securities and investments can rise or fall, and there is no guarantee. Investors may not recover their initial investment amount; past performance does not necessarily predict future results. The securities trading services of Victory Securities are provided by Victory Securities Limited (hereinafter referred to as 'Victory Securities'). This document was prepared and authorized for release on this platform by Victory Securities Limited. The information contained herein is for reference purposes only, and Victory Securities reserves the right to change or terminate without prior notice. All information provided on this platform cannot be reproduced, linked, reposted, or otherwise used by any media, website, or individual without prior written authorization from Victory Securities. Authorized users must attribute the source of this document to Victory Securities and commit to complying with relevant laws and internet usage practices worldwide, refraining from illegal purposes or methods. Violators will bear all related legal and financial responsibilities. Data cited in this document may be sourced from third parties; Victory Securities does not guarantee the accuracy, fairness, timeliness, completeness, or correctness of any data, forecasts, and/or opinions contained herein, nor does it assume legal responsibility for any benchmarks upon which such forecasts and/or opinions are based. Any forward-looking statements in this document should not be considered guarantees of future performance, and actual developments may differ significantly. This document is neither an offer nor a solicitation for the purchase or sale of any securities or investment decision-making basis, nor should it be interpreted as professional advice. Readers or those making investment decisions should fully understand the risks and the associated legal, tax, and accounting implications, and decide whether investing aligns with their personal objectives and risk tolerance, seeking appropriate professional advice if necessary. In certain countries, dissemination and distribution of this document may be restricted by law, and recipients are responsible for compliance with such restrictions.
Risk Disclaimer: The above content only represents the author's view. It does not represent any position or investment advice of Futu. Futu makes no representation or warranty.Read more

Comments
to post a comment
2