
The moving averages of the Hang Seng Index are sloping downward, narrowing the Bollinger Bands, with 25,000 points becoming a key support level.
Last Thursday (April 2nd) $Hang Seng Index (800000.HK)$
The index closed at 25,116.53 points for the day, slightly falling by 0.70%, with a trading volume of 243.628 billion yuan. Trading activity contracted somewhat, and the overall market is in a weak consolidation phase. The following provides a detailed breakdown analysis based on technical data:
In our 【HK Stock Broadcast】, we commented on the Hang Seng Index: Bullish investors believe that southbound capital is aggressively buying, with support at 25,000, holding bullish warrants overnight, and a stop-loss level at 24,666 points. Bearish investors are buying bearish warrants overnight, believing that after the holidays, it will drop to fill the gap at 24,800.
1. Trend and Volatility Range: The Hang Seng Index is currently in a weak consolidation phase following a recent decline. The nearby high is 28,056.10 points, and the nearby low is 24,203.54 points, resulting in an overall range of approximately 3,852.56 points, or about 15.9% volatility. The current price is in the lower-middle part of this range, neither close to the lowest point nor at a position conducive to a strong rebound.
2. Support and Resistance: Immediate support lies between 25,000 and 24,800 points, which serves as both a psychological threshold and a zone of recent tussle. A further breakdown could push the index towards 24,666 points, and then possibly towards the recent low at 24,203 points (close to the bull certificate recovery price). Resistance initially stands at 25,350 to 25,550 points, near short-term moving averages and the middle Bollinger Band. Further resistance is seen at 25,800 to 26,000 points, marking a potential rebound resistance zone.
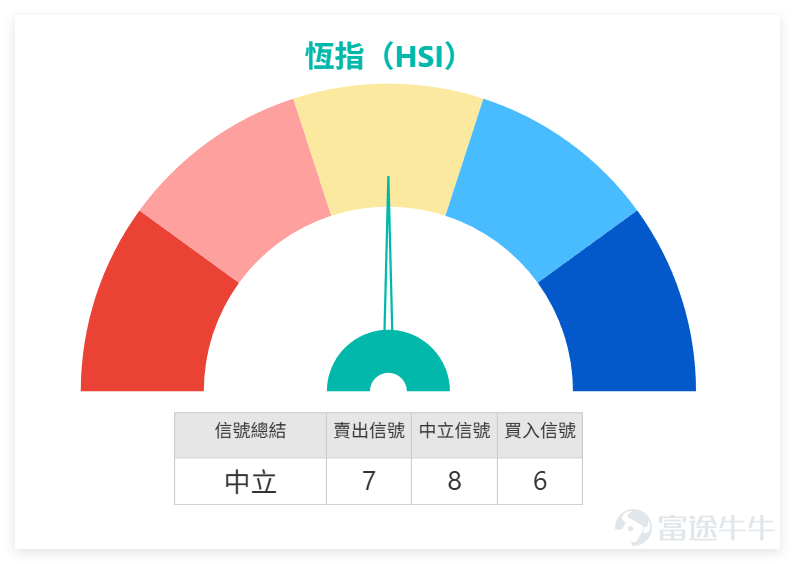
3. Core Technical Indicators: The closing price is 25,116.53 points, below the MA10 (24,981.73 points), MA30 (25,651.04 points), and MA60 (26,251.38 points), with all moving averages trending downward. The RSI is at 45, indicating a neutral-to-weak range. The overall technical indicator signals are neutral, with a signal strength of 8. Multiple oscillating indicators show neutral readings, without any extreme overbought or oversold conditions.

4. Additional Technical Status: There are signs of narrowing in the Bollinger Bands, with the current price hovering near the lower-middle band, showing no clear upward expansion, indicating weak and narrow consolidation, with direction yet unclear. Moving averages continue to press downward, and the medium- to short-term trend has not yet reversed.
On April 2nd, key blue-chip stocks generally declined, with only China Mobile and Construction Bank posting slight gains. Technical signals were notably divergent, with detailed breakdowns as follows:
1. Buy Signal Stocks (4 stocks):
Tencent (00700) closed at HKD 489.2 (-1.49%), RSI 37 nearing oversold conditions;
Alibaba (09988) closed at HKD 118.5 (-3.42%), RSI 35 nearing oversold conditions;
Meituan (03690) closed at HKD 80.25 (-2.07%), RSI 45 neutral;
Xiaomi (01810) closed at HKD 30.88 (-3.56%), RSI 36 nearing oversold conditions,
All four received buy signals, with signal strength of 9-11, accumulating technical rebound demand.
2. Neutral signal stocks (1 stock): HKEX (00388) closed at HKD 396 (-1.10%), RSI 47 neutral, neutral signal strength 8, short-term trend unclear.
3. Sell signal stocks (5):
CCB (00939) closed at HKD 8.45 (+0.48%), RSI 66 overbought, sell signal strength 9;
AIA (01299) closed at HKD 86.15 (-1.54%),
HSBC (00005) closed at HKD 130 (-0.23%),
China Mobile (00941) closed at HKD 80.05 (+0.31%),
Ping An (02318) closed at HKD 60.2 (-0.66%). The RSI is in a neutral to slightly bullish range, with sell signal strength at 8-10, indicating profit-taking pressure.
Overall data reflects: Blue-chip sector showing a 'more declines, fewer rises' pattern; buy-signal stocks are mostly near oversold levels, while sell-signal stocks face profit-taking pressure. The market is balancing between rebound demand and adjustment pressures.
Review and Selection of Hang Seng Index (HSI) Warrants and Bull/Bear Products: Rational Deployment of Leverage Opportunities Amid Weak Consolidation
(1) Review of Recent Warrants
Reviewing the Hang Seng Index-related CBBC bull and bear products recommended on March 27, they performed steadily: BOC Bear Certificate (61183) rose 14% after two days, and BOC Bear Certificate (60639) increased by 17%, outperforming the Hang Seng Index's -0.66% during the same period, capturing leveraged gains for investors who were bearish on the Hang Seng Index.
(II) Hang Seng Index Warrant Selection:
Considering the HSI's slight consolidation on April 2nd with a mixed outlook between bulls and bears, two warrant products have been carefully selected to align with varying trading expectations, providing investors with actionable insights matching the day’s market rhythm:
1. UBS Group Call Warrant (25916): Actual leverage of 6.8, exercise price at 25,000 points, relatively high leverage, suitable for investors optimistic about the Hang Seng Index holding above 25,000 points and expecting a weak rebound.
2. BOC Put Warrant (26633): Actual leverage of 7.6, exercise price at 23,383 points, with ideal leverage and implied volatility, suitable for investors who believe the Hang Seng Index will fill the gap at 24,800 and weaken in the short term.
Risk Warning: The HSI is in weak consolidation, with the key level of 25,000 points acting as a pivotal point for bulls and bears. Overnight risks in bull/bear certificates should not be overlooked. Investors participating in warrants and bull/bear certificates should assess their risk tolerance, rationally manage positions, and closely monitor support/resistance levels and volume changes in the HSI.
Among blue-chip rebound candidates, which stock do you favor most? A, Tencent; B, Alibaba; C, Xiaomi. Feel free to share your thoughts in the comments section.
Reminder: This article does not constitute any investment advice.
This article is for reference only and does not constitute any investment advice. The market data, opinions, and analysis contained herein may change at any time without prior notice. We are not responsible for any loss or damage caused by reliance on the information in this article. Technical analysis only shows whether certain technical conditions are met; a comprehensive assessment of asset performance should be conducted using additional data. Decisions to trade should not be based solely on this article. Please note that past performance is not indicative of future results.
#HongKongStocks #HangSengIndex #Real-TimeAnalysis #WarrantSelection #WarrantGuide #DerivativesHedging #Blue-ChipStocks #TechnicalAnalysis
Risk Disclaimer: The above content only represents the author's view. It does not represent any position or investment advice of Futu. Futu makes no representation or warranty.Read more
Comments
to post a comment