
English
Back
Open Account
港股窩輪Jenny
wrote a column · Apr 2 13:47

Xiaomi hits a 52-week low, is it a short-term oversold rebound or will it continue to test new lows?

$XIAOMI-W (01810.HK)$ Xiaomi Auto announced that its March deliveries exceeded 20,000 units, with cumulative deliveries of the new SU7 surpassing 7,000 units. However, some analysts pointed out that by the first quarter of 2026, Xiaomi’s cumulative deliveries reached only about 80,000 units, achieving just 14% of the annual target. This news weighed on the stock price, causing it to drop over 4%, hitting a low of 30.52 yuan and reaching a 52-week low. The stock has successively broken below the 10-day (32.28 yuan), 30-day (33.59 yuan), and 60-day (34.99 yuan) moving averages, showing a clearly bearish intermediate technical pattern.
However, after continuous adjustments, multiple short-term indicators have entered deeply oversold zones and are showing initial divergence signals, suggesting that downward momentum is gradually weakening. A short-term rebound window is brewing. In terms of price levels, the primary resistance above is at 33.2 yuan, with further resistance at 35.7 yuan; initial support below is at 29.9 yuan, and if it breaks below this, it may test the key support area at 26.7 yuan.
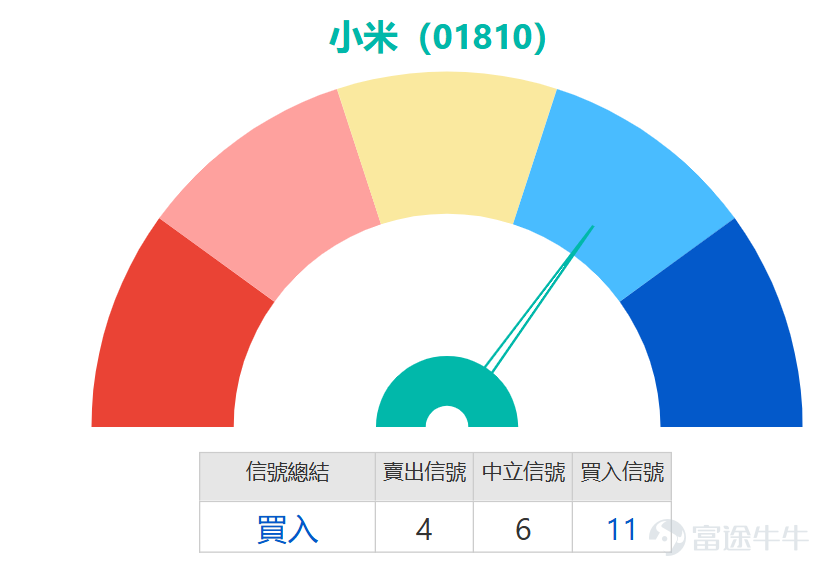
Indicator structures show clear divergences: mid-term trend indicators such as MACD and Bollinger Bands still maintain sell signals, but short-term momentum indicators have shown signs of improvement. Stochastic oscillators and Williams %R both indicate oversold conditions, while the CCI indicator has formed a 'bottom divergence' pattern. Momentum oscillators are issuing buy signals, reflecting that downward momentum is rapidly weakening. Divergence between price and momentum often serves as a leading signal for short-term reversals, with RSI falling to a low level of 37.
Overall, Xiaomi currently remains in a weak pattern below the moving average system, with the mid-term trend not yet reversed. However, multiple oscillation indicators simultaneously showing oversold conditions along with bottom divergence signals have significantly increased the probability of a technical rebound occurring in the support zone between 29.9 and 26.7 yuan. Short-term traders should avoid being overly bearish at this point and focus on momentum-strengthening signals near critical support levels, presenting an overall situation of 'increasing chances for a short-term rebound, pending confirmation of the mid-term trend.' Investors can position themselves for a short-term rebound in the support region, targeting 33.2 yuan as the initial profit objective, while strictly adhering to stop-loss discipline.
The street-level data also confirms the forward-looking deployment of capital: the trading volume of call warrants has increased for three consecutive days, rising from 5999.85 million units on March 30 to 6065.58 million units on April 1, with a cumulative increase of 65.73 million units, reflecting a gradual rise in bullish sentiment; the trading volume of put warrants first rose and then fell, cumulatively decreasing by 15.55 million units, indicating that short-term bearish forces have somewhat diminished. The trading volume of bull contracts has grown particularly strongly, surging by 104.86 million units over three days, an increase of 22.22%, showing that leveraged bullish funds are entering the market at an accelerated pace; the trading volume of bear contracts has slightly declined, decreasing by 6.22 million units cumulatively, suggesting overall stability among leveraged bearish funds.
$XIAOMI-W (01810.HK)$ Xiaomi Auto announced that its March deliveries exceeded 20,000 units, with cumulative deliveries of the new SU7 surpassing 7,000 units. However, some analysts pointed out that by the first quarter of 2026, Xiaomi’s cumulative deliveries reached only about 80,000 units, achieving just 14% of the annual target. This news weighed on the stock price, causing it to drop over 4%, hitting a low of 30.52 yuan and reaching a 52-week low. The stock has successively broken below the 10-day (32.28 yuan), 30-day (33.59 yuan), and 60-day (34.99 yuan) moving averages, showing a clearly bearish intermediate technical pattern. However, after continuous adjustments, multiple short-term indicators have entered deeply oversold zones and are showing initial divergence signals, suggesting that downward momentum is gradually weakening. A short-term rebound window is brewing. In terms of price levels, the primary resistance above is at 33.2 yuan, with further resistance at 35.7 yuan; initial support below is at 29.9 yuan, and if it breaks below this, it may test the key support area at 26.7 yuan. Indicator structures show clear divergences: mid-term trend indicators such as MACD and Bollinger Bands still maintain sell signals, but short-term momentum indicators have shown signs of improvement. Stochastic oscillators and Williams %R both indicate oversold conditions, while the CCI indicator has formed a 'bottom divergence' pattern. Momentum oscillators are issuing buy signals, reflecting that downward momentum is rapidly weakening. Divergence between price and momentum often serves as a leading signal for short-term reversals, with RSI falling to a low level of 37. Overall, Xiaomi remains in a weak pattern below the moving average system, with the mid-term trend yet to...
After being mentioned on March 31, 2026, Xiaomi's (01810) share price fell cumulatively by 3.21% over two days, while bearish products across the board recorded significant gains, among which $BIXIAMI@EP2606B.P (13235.HK)$ rose by 17%, $JP#XIAMIRP2810G.P (60434.HK)$ up 15%, $UBXIAMI@EP2605A.P (23061.HK)$ increased by 14%, $UB#XIAMIRP2810E.P (59592.HK)$ rose by 13%
$XIAOMI-W (01810.HK)$ Xiaomi Auto announced that its March deliveries exceeded 20,000 units, with cumulative deliveries of the new SU7 surpassing 7,000 units. However, some analysts pointed out that by the first quarter of 2026, Xiaomi’s cumulative deliveries reached only about 80,000 units, achieving just 14% of the annual target. This news weighed on the stock price, causing it to drop over 4%, hitting a low of 30.52 yuan and reaching a 52-week low. The stock has successively broken below the 10-day (32.28 yuan), 30-day (33.59 yuan), and 60-day (34.99 yuan) moving averages, showing a clearly bearish intermediate technical pattern. However, after continuous adjustments, multiple short-term indicators have entered deeply oversold zones and are showing initial divergence signals, suggesting that downward momentum is gradually weakening. A short-term rebound window is brewing. In terms of price levels, the primary resistance above is at 33.2 yuan, with further resistance at 35.7 yuan; initial support below is at 29.9 yuan, and if it breaks below this, it may test the key support area at 26.7 yuan. Indicator structures show clear divergences: mid-term trend indicators such as MACD and Bollinger Bands still maintain sell signals, but short-term momentum indicators have shown signs of improvement. Stochastic oscillators and Williams %R both indicate oversold conditions, while the CCI indicator has formed a 'bottom divergence' pattern. Momentum oscillators are issuing buy signals, reflecting that downward momentum is rapidly weakening. Divergence between price and momentum often serves as a leading signal for short-term reversals, with RSI falling to a low level of 37. Overall, Xiaomi remains in a weak pattern below the moving average system, with the mid-term trend yet to...
For investors who believe a technical rebound is about to begin, they can focus on a product with leverage of approximately 6.1 times and a strike price of 36.99 yuan, $BIXIAMI@EC2609F.C (26555.HK)$ which stands out for having the lowest premium, enabling it to effectively track the underlying stock's rebound; if pursuing higher leverage and low premium, consider $HS#XIAMIRC2612C.C (68839.HK)$ , with a recovery price of 25 yuan, offering about 4.5 times actual leverage.
Conversely, if you judge the rebound will be weak and the stock price will continue to test support level 2, you can consider put warrants with a strike price of around 29.86 yuan, such as $BIXIAMI@EP2607B.P (23123.HK)$ or options with ideal leverage and implied volatility. $HSXIAMI@EP2607A.P (23111.HK)$Investors who are bearish on the future market and expect the rebound to end near $34 can pay attention to products with an actual leverage of up to 9.6 times and a recovery price at $34.$JP#XIAMIRP2809J.P (65162.HK)$Or consider products with the highest actual leverage (7.9 times).$UB#XIAMIRP2812M.P (66582.HK)$
$XIAOMI-W (01810.HK)$ Xiaomi Auto announced that its March deliveries exceeded 20,000 units, with cumulative deliveries of the new SU7 surpassing 7,000 units. However, some analysts pointed out that by the first quarter of 2026, Xiaomi’s cumulative deliveries reached only about 80,000 units, achieving just 14% of the annual target. This news weighed on the stock price, causing it to drop over 4%, hitting a low of 30.52 yuan and reaching a 52-week low. The stock has successively broken below the 10-day (32.28 yuan), 30-day (33.59 yuan), and 60-day (34.99 yuan) moving averages, showing a clearly bearish intermediate technical pattern. However, after continuous adjustments, multiple short-term indicators have entered deeply oversold zones and are showing initial divergence signals, suggesting that downward momentum is gradually weakening. A short-term rebound window is brewing. In terms of price levels, the primary resistance above is at 33.2 yuan, with further resistance at 35.7 yuan; initial support below is at 29.9 yuan, and if it breaks below this, it may test the key support area at 26.7 yuan. Indicator structures show clear divergences: mid-term trend indicators such as MACD and Bollinger Bands still maintain sell signals, but short-term momentum indicators have shown signs of improvement. Stochastic oscillators and Williams %R both indicate oversold conditions, while the CCI indicator has formed a 'bottom divergence' pattern. Momentum oscillators are issuing buy signals, reflecting that downward momentum is rapidly weakening. Divergence between price and momentum often serves as a leading signal for short-term reversals, with RSI falling to a low level of 37. Overall, Xiaomi remains in a weak pattern below the moving average system, with the mid-term trend yet to...
Xiaomi’s current technical indicators show clear divergence between short-term and medium-term signals. Do you prefer following the medium-term trend to go short or betting on a short-term oversold rebound? If Xiaomi's share price subsequently tests the initial support level at $29.9, do you think the stock price will stabilize? Feel free to share your insights in the comments section. For more market analysis, keep following 'HK Stock Warrants Jenny' for daily updates!$Hang Seng Index (800000.HK)$$Hang Seng TECH Index (800700.HK)$
Reminder: This article does not constitute any investment advice.
This article is for reference only and does not constitute any investment advice. The market data, opinions, and analysis contained herein may change at any time without prior notice. We are not responsible for any loss or damage caused by reliance on the information in this article. Technical analysis only shows whether certain technical conditions are met; a comprehensive assessment of asset performance should be conducted using additional data. Decisions to trade should not be based solely on this article. Please note that past performance is not indicative of future results.
#HKStocks #RealTimeAnalysis #WarrantPick #WarrantGuide #DerivativesHedging #HKWarrantsJenny #Xiaomi #01810 #TechStocks
Risk Disclaimer: The above content only represents the author's view. It does not represent any position or investment advice of Futu. Futu makes no representation or warranty.Read more
80K Views
Report
Comments
Write a Comment...