
US-Iran mutual attacks paused! Is geopolitical risk temporarily lifted?

Has the bottom arrived? Let's see how this $558 million 'smart money' is positioning itself
Last night, as Trump and the Iranian President signaled intentions to de-escalate tensions,The market saw a sentiment-driven rebound, with US stocks surging across the board.: $Nasdaq Composite Index (.IXIC.US)$ Soaring 3.45%, $S&P 500 Index (.SPX.US)$ Up 2.91%, $Dow Jones Industrial Average (.DJI.US)$ Closing 2.49% higher.
This raises a key question: Has the market bottomed out? Is this a trend reversal or merely a sentiment-driven bounce? Is now the time to enter?
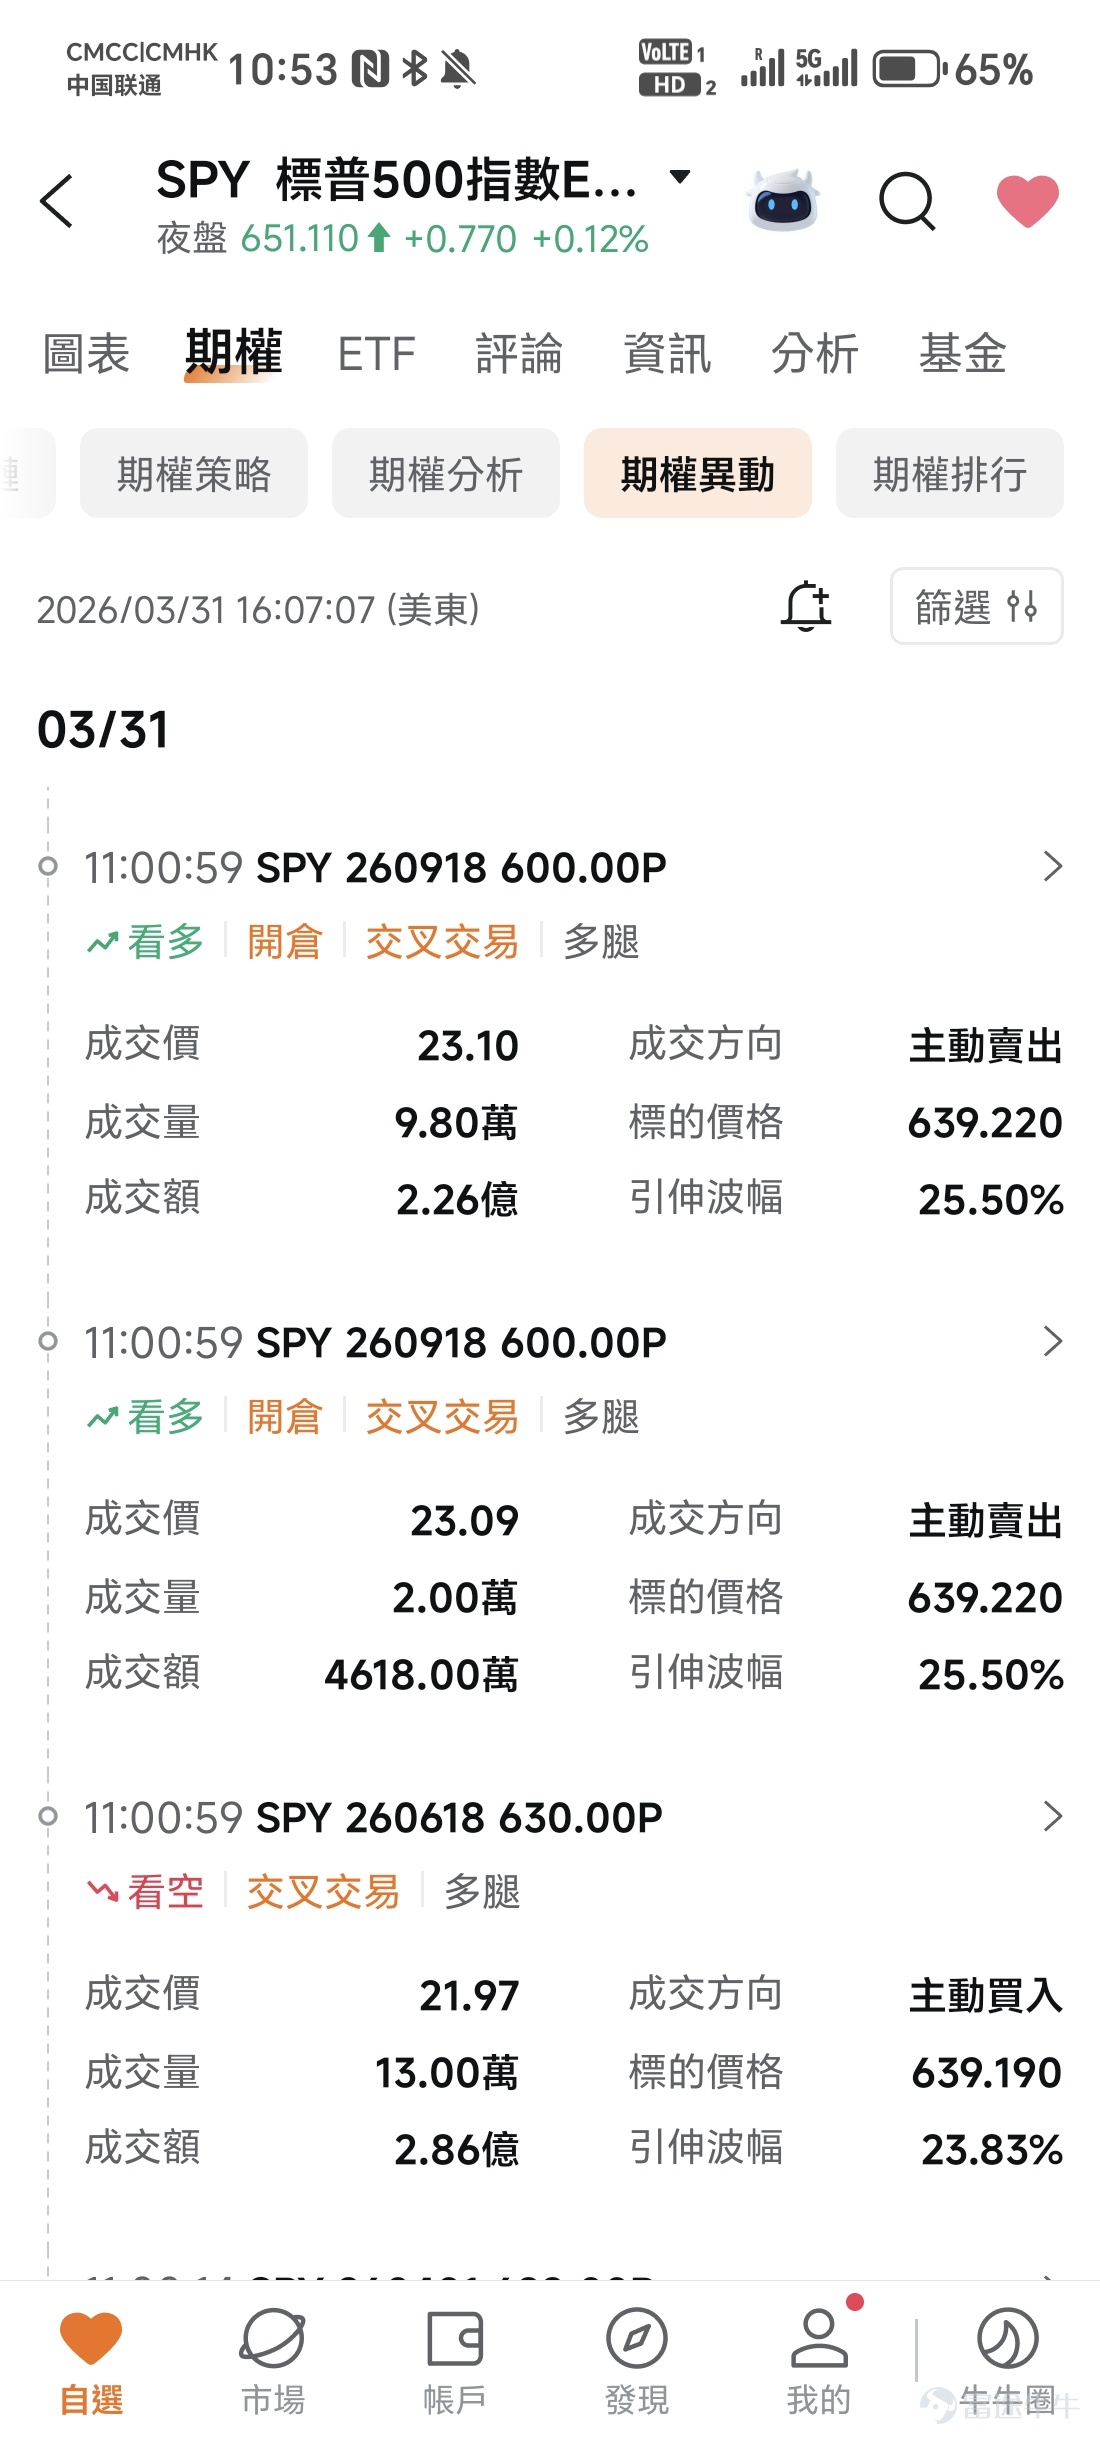
At this point, it’s worth examining what the “smart money” is doing. In SPY’sOptions - Unusual Options Activitywe can seeAn options portfolio order worth $558 million. This transaction clearly shows that funds are not simply shifting to bullish positions, but rather managing risks amid a rising market.The core signal can be summarized as: short-term caution, medium-term bullishness.
![Last night, as Trump and Iran’s president both signaled signs of easing tensions,The market saw a sentiment-driven rebound, with US stocks surging across the board: $Nasdaq Composite Index (.IXIC.US)$ Surging 3.45%, $S&P 500 Index (.SPX.US)$ Up 2.91%, $Dow Jones Industrial Average (.DJI.US)$ Closing 2.49% higher. This raises a key question: Has the market bottomed out? Is this a trend reversal, or merely a sentiment-driven rebound? Is now the time to enter? It may be helpful to look at what the 'smart money' is doing. In SPY'sOptions - Unusual Options ActivityWe can see thatan options portfolio order worth $558 million. From this trade, it is clear that funds are not simply shifting to a bullish stance but rather managing risk amid an upward trend.The core signal can be summarized as: short-term caution, medium-term bullishness. Options Fund Flow: Analysis of the $558 Million Signal Let’s break down this order in detail. This is a typicalBearish Diagonal Put Spread,primarily composed of two parts: [Buy]Buying put options with an expiration date of June 18 and a strike price of 630, with a position size of $286 million; [Sell]Selling put options with an expiration date of September 18 and a strike price of 600, with a position size of $226 + $42 = $272 million; If we break down the strategy by individual legs...](https://nnqimage.futunn.com/sns_client_feed/999908/20260401/web-1775031828148-Us3NNfTcI0.jpeg/big?area=2&is_public=true&imageMogr2/ignore-error/1/format/webp)
Options fund flow: Analysis of the $558 million bet signal
Let’s break down this order in detail. This is a typicalBearish Diagonal Put Spread, mainly composed of two parts:
 Buying put options expiring on June 18 with a strike price of $630, with a position size of $286 million;Selling put options expiring on September 18 with a strike price of $600, with a position size of $226 + $42 = $272 million;
If we analyze each leg separately, this strategy expressesShort-term (within three months) bearish, mid to long-term (three to six months) bottom stabilizing, bullish expectation。
Theoretical return curve of the overall strategyAs shown in the figure. If the stock price falls below 600 during the option's expiration period, the overall strategy will incur losses. The strategy performs best when the stock price is within the 600-620 USD range, and then the returns gradually decrease as the stock price increases. After the June options expire, the position will shift to selling a single-leg put option, with the mid-term structure turning bullish.
![Last night, as Trump and Iran’s president both signaled signs of easing tensions,The market saw a sentiment-driven rebound, with US stocks surging across the board: $Nasdaq Composite Index (.IXIC.US)$ Surging 3.45%, $S&P 500 Index (.SPX.US)$ Up 2.91%, $Dow Jones Industrial Average (.DJI.US)$ Closing 2.49% higher. This raises a key question: Has the market bottomed out? Is this a trend reversal, or merely a sentiment-driven rebound? Is now the time to enter? It may be helpful to look at what the 'smart money' is doing. In SPY'sOptions - Unusual Options ActivityWe can see thatan options portfolio order worth $558 million. From this trade, it is clear that funds are not simply shifting to a bullish stance but rather managing risk amid an upward trend.The core signal can be summarized as: short-term caution, medium-term bullishness. Options Fund Flow: Analysis of the $558 Million Signal Let’s break down this order in detail. This is a typicalBearish Diagonal Put Spread,primarily composed of two parts: [Buy]Buying put options with an expiration date of June 18 and a strike price of 630, with a position size of $286 million; [Sell]Selling put options with an expiration date of September 18 and a strike price of 600, with a position size of $226 + $42 = $272 million; If we break down the strategy by individual legs...](https://nnqimage.futunn.com/sns_client_feed/999908/20260401/web-1775031828302-IqJMryqX7t.png/big?area=2&is_public=true&imageMogr2/ignore-error/1/format/webp)
Notably, this trade was initiated when the S&P 500 had already risen by about 1% on the day, indicating that thisIs not a preemptive bearish bet but rather a hedging position established during an upward market trend.The purchased June 630 put option provides protection for short-term pullbacks; the sold September 600 put option clearly rules out systemic downside risks while financing the hedging strategy by collecting premiums.
This position signal shows that investors expect possible pullbacks during the upward movement, but no systemic crash—though one should be cautious of short-term pullbacks after downside rebounds.
Fundamentals: Risk subsiding, but certainty yet to arrive
The cautious positioning in the options market aligns closely with the broader macro backdrop. The recent rebound was not driven by fundamental improvements but by compressed risk premiums. Previously, the biggest drag on the market was inflationary pressures triggered by Middle East tensions, particularly the risk of supply chain disruptions in the Strait of Hormuz. Oil prices surging above 100 USD reignited concerns about 'higher rates for longer.'
With easing signals emerging, part of the aforementioned logic has reversed:Slight drop in oil prices, easing inflation expectations, reduced interest rate pressure, and upward revision of growth stock valuations — This also explains the strong performance of the Nasdaq index.
However, this shift merely represents a reduction in risk rather than an increase in certainty. Conflicts have not been fully resolved, and policy paths remain uncertain; both oil prices and inflation could accelerate again. In this environment, long-term capital remains cautious. Investors like Buffett are still holding high cash positions and have not aggressively bottom-fished. Their stance reflects straightforward logic: valuations are not yet sufficiently attractive, and macro-level signals remain unclear.
The market thus presents a consistent picture: long-term investors are on the sidelines while options traders participate with hedging. Both sides express the same core belief:The direction is becoming clearer, but the path remains uncertain.
Conclusion
By combining options capital flows with macro fundamental signals, more actionable conclusions can be drawn:The market is transitioning from tail-risk pricing to a soft-landing narrative, but the process is not yet complete and volatility will likely persist. The rebound has been driven more by improved expectations than confirmed fundamentals, making timing and risk management critical.
For investors, the optimal strategy is neither blindly chasing gains nor staying on the sidelines, but adopting a 'participation + protection' framework:
Trend-following investors: Avoid chasing highs after significant rallies; gradually build positions during pullbacks or consolidation phases.Options strategy: Considera bearish diagonal spread with puts, maintaining profit exposure while hedging against short-term downside risks;Volatility strategy: If expecting a range-bound market, consider usingan Iron Condor strategyto capture volatility contraction, which involves opening Straddle/Strangle positions in the middle and hedging with reverse option legs on both sides;(The design images displayed on screen are for illustrative purposes only and do not constitute any investment advice or guarantees; market conditions fluctuate frequently, and the option prices shown do not represent real-world values.)
![Last night, as Trump and Iran’s president both signaled signs of easing tensions,The market saw a sentiment-driven rebound, with US stocks surging across the board: $Nasdaq Composite Index (.IXIC.US)$ Surging 3.45%, $S&P 500 Index (.SPX.US)$ Up 2.91%, $Dow Jones Industrial Average (.DJI.US)$ Closing 2.49% higher. This raises a key question: Has the market bottomed out? Is this a trend reversal, or merely a sentiment-driven rebound? Is now the time to enter? It may be helpful to look at what the 'smart money' is doing. In SPY'sOptions - Unusual Options ActivityWe can see thatan options portfolio order worth $558 million. From this trade, it is clear that funds are not simply shifting to a bullish stance but rather managing risk amid an upward trend.The core signal can be summarized as: short-term caution, medium-term bullishness. Options Fund Flow: Analysis of the $558 Million Signal Let’s break down this order in detail. This is a typicalBearish Diagonal Put Spread,primarily composed of two parts: [Buy]Buying put options with an expiration date of June 18 and a strike price of 630, with a position size of $286 million; [Sell]Selling put options with an expiration date of September 18 and a strike price of 600, with a position size of $226 + $42 = $272 million; If we break down the strategy by individual legs...](https://nnqimage.futunn.com/sns_client_feed/999908/20260401/web-1775031828473-NvgeR6082H.png/big?area=2&is_public=true&imageMogr2/ignore-error/1/format/webp)
In short: The market is pricing in risk, but funds are still hedging for potential future risks.
Risk Disclaimer: The above content only represents the author's view. It does not represent any position or investment advice of Futu. Futu makes no representation or warranty.Read more

Comment (1)
to post a comment
14
8