

"AI Bottleneck Trade" Ignites Upstream Sector—Who’s Raking in the Profits?

Tencent faces resistance at higher levels; key resistance levels will determine the direction
Hong Kong stocks opened significantly higher this morning, $Hang Seng Index (800000.HK)$ The market rose 2.3% at the open, $Hang Seng TECH Index (800700.HK)$ With gains reaching 2.75%, led by the tech giant $TENCENT (00700.HK)$
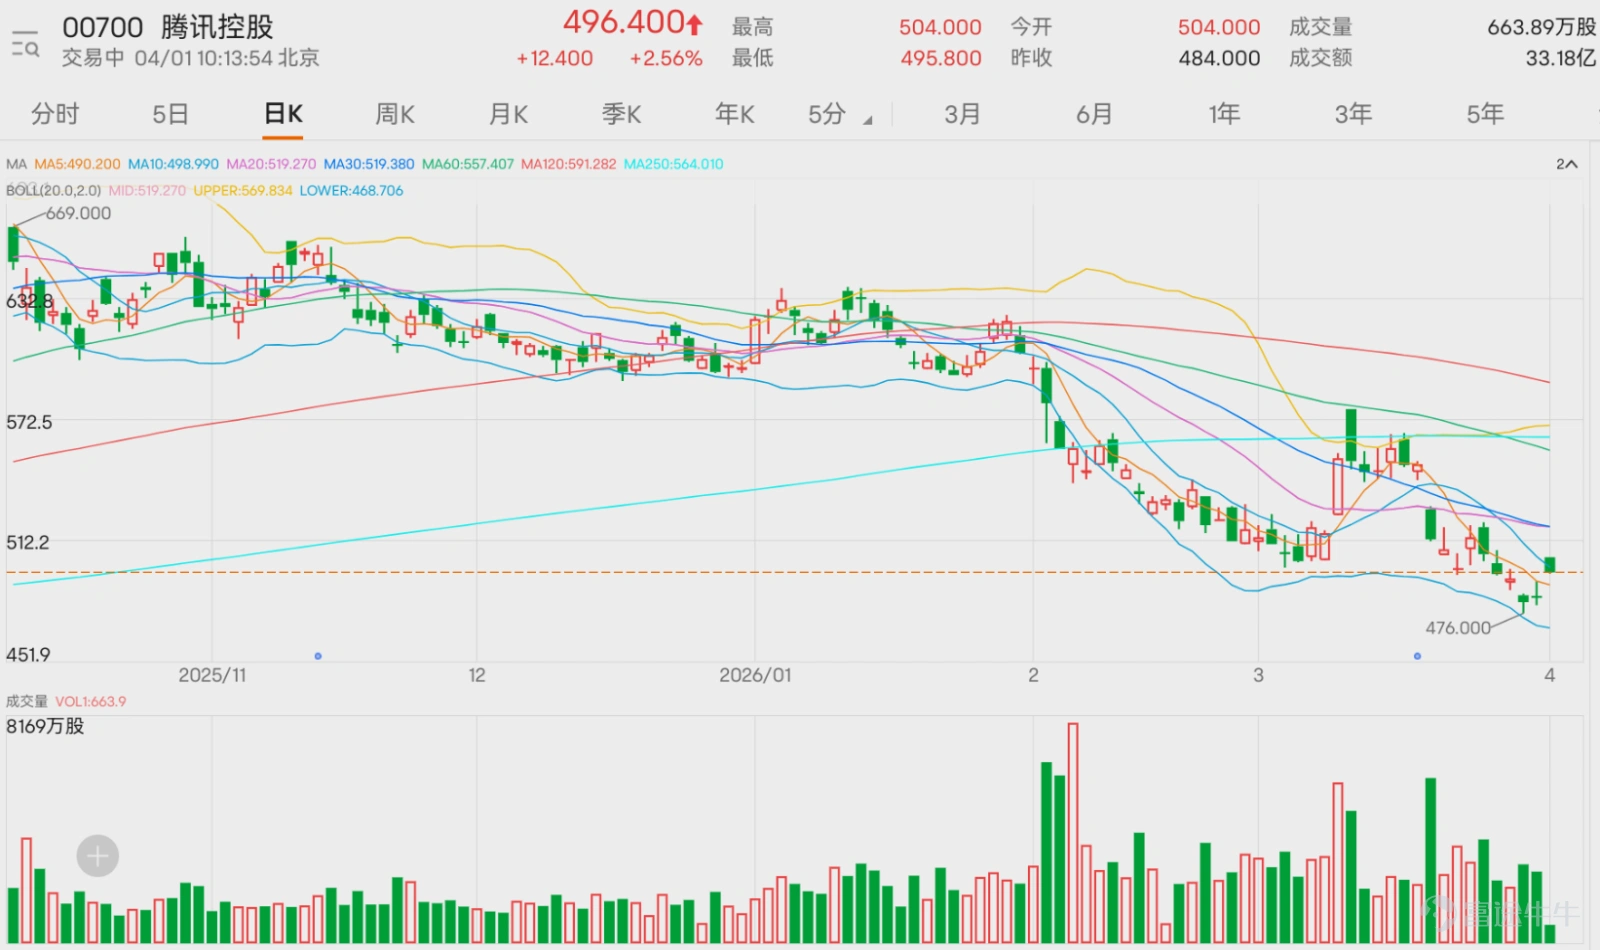
The market opened at HKD 504, up more than 4% at the start, but encountered resistance at higher levels and retreated, narrowing gains to 2.56%, with the latest quote at HKD 496.4. Tencent's share price is still below several key moving averages such as MA30 (HKD 520.57) and MA60 (HKD 559.52), indicating that the medium-term adjustment pattern has not yet changed.
In terms of oscillation indicators, both the Stochastic Oscillator and Williams %R are in oversold territory, issuing buy signals. The RSI is at an oversold level of 32, and the CCI indicator also suggests 'severe oversold conditions, possible bottoming'. Multiple indicators show that short-term downward momentum may have weakened, with conditions for a technical rebound gradually building. However, trend indicators remain bearish, with ADX and MACD signals still pointing to sell, implying that the initial rebound is likely a technical correction rather than a trend reversal.
On the downside support, the primary support level is 468 yuan; if it breaks, it may further drop to a strong support zone at 428 yuan. On the upside resistance, the first resistance level is 518 yuan (near the MA30 moving average). If there is significant volume breaking through, it could rise to the second resistance level of 550 yuan (coinciding with the MA60 moving average and the previous consolidation platform), which is also a key turning point for whether the mid-term trend can reverse.
Tencent is currently in a contradictory state of 'accumulating short-term oversold rebound momentum' versus 'weak medium-term trends.' Data shows a short-term upward probability of 53%, with an expected 5-day volatility of 9.4%, indicating significantly increased volatility. In terms of operations, the range between HKD 468-484 can be used as a short-term observation window for phased positioning, with a stop-loss set below HKD 428. If it can break above HKD 518 on high volume, the strength of the rebound can be confirmed; otherwise, there is a need to be cautious about the risk of breaking below HKD 468 and opening up further downside.
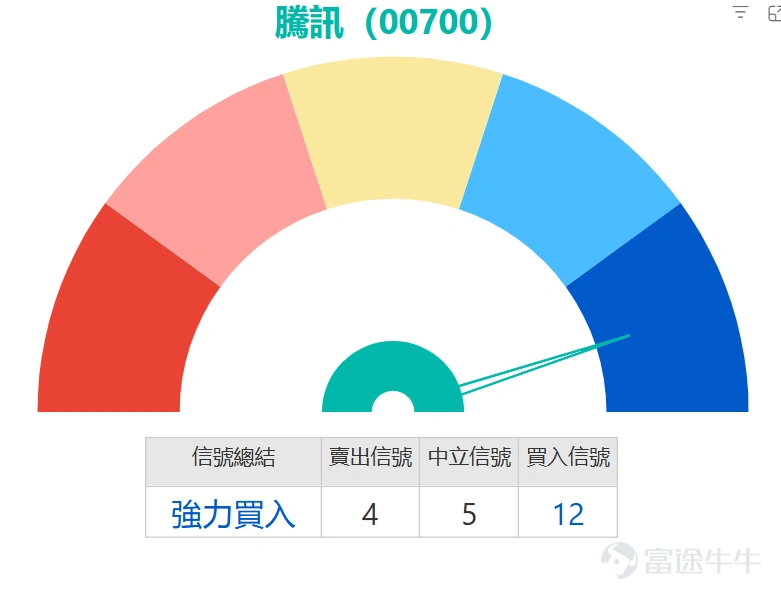
Street-level data from March 27 to March 31 shows significant capital divergence: call warrant street volume increased consecutively from 10,137.93 million shares to 10,601.52 million shares, a cumulative increase of 463.59 million shares, showing long-term funds taking positions on dips and betting on a rebound. Put warrant street volume decreased consecutively from 275.29 million shares to 231.44 million shares, a cumulative reduction of 43.85 million shares, reflecting a noticeable contraction in short-selling momentum and diminishing market expectations for further sharp declines.
In terms of bull and bear warrants, bull warrant street volume dropped sharply from 1,067.29 million shares to 789.97 million shares, a cumulative decrease of 277.32 million shares, mainly due to a large number of bull warrants being forcibly called back as the share price fell, thoroughly cleansing short-term leveraged long positions. Bear warrant street volume initially declined from 198.78 million shares to 181.69 million shares but rebounded to 191.55 million shares on March 31, indicating some capital positioning in bear warrants to bet on a secondary pullback after the rebound, with bears repositioning at relatively high levels.
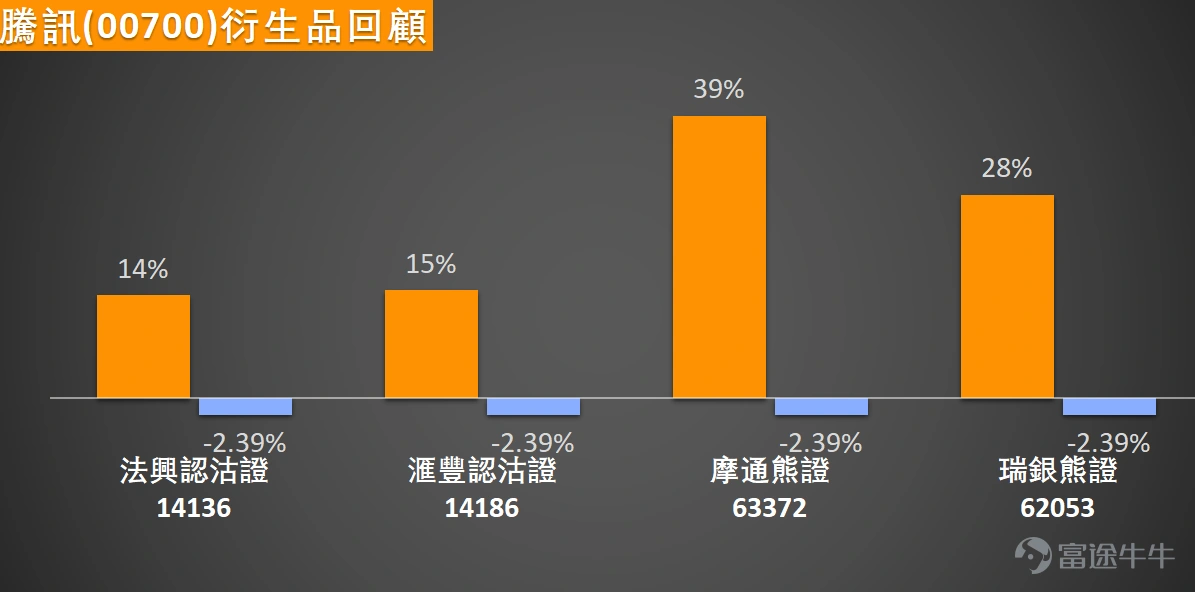
Market data on March 25, 2026, shows that Tencent Holdings (00700) recorded a 2.39% drop in the underlying stock two days later, while derivatives aligned with short positions posted substantial gains, among which $SGTENCT@EP2612A.P (14136.HK)$ the gain reached 14%, $HSTENCT@EP2612A.P (14186.HK)$ The increase was 15%, $JP#TENCTRP2810I.P (63372.HK)$ The increase reached as high as 39%, $UB#TENCTRP2812U.P (62053.HK)$ The increase also reached 28%
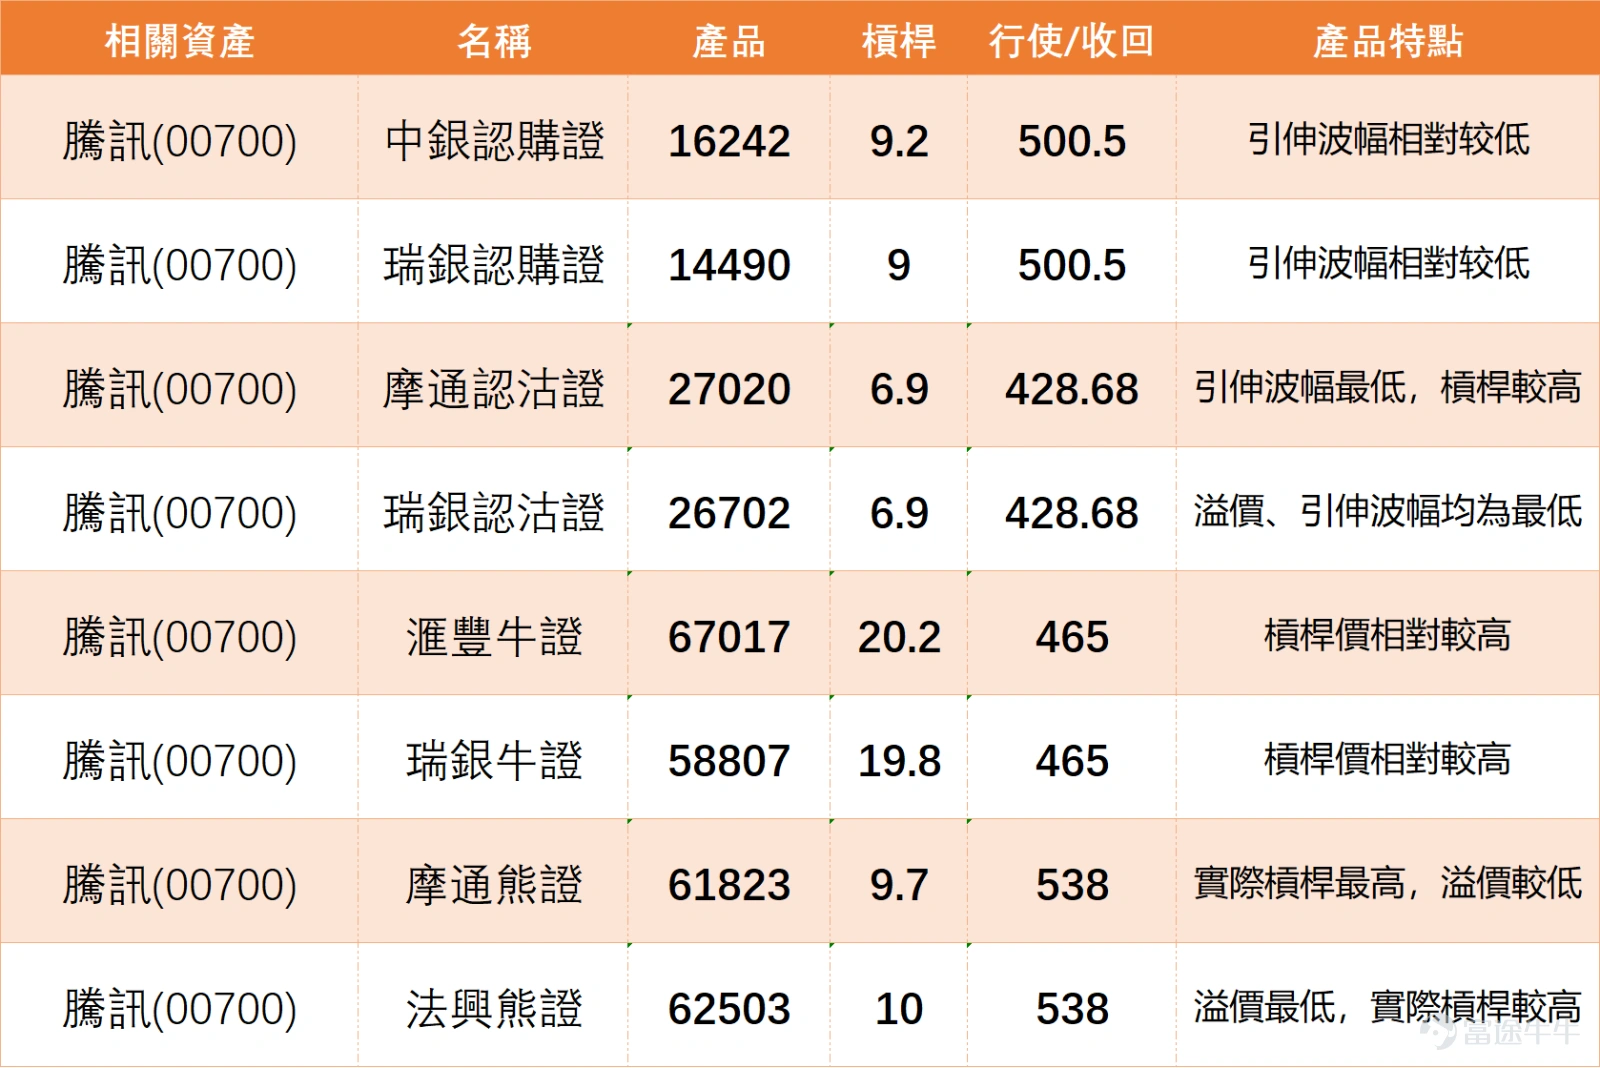
Based on the current technical pattern of Tencent (00700) stock price struggling around the key level of HKD 500, the market is awaiting a directional breakout. To align with short-term trading strategies, a selection of warrants and bull/bear certificates has been curated, covering call warrants, put warrants, bull contracts, and bear contracts to address potential breakouts in either direction.
For those optimistic about Tencent breaking upward, out-of-the-money call warrants can be considered. Among them, $BITENCT@EC2606B.C (16242.HK)$ the exercise price is HKD 500.5, with relatively low implied volatility, reducing cost burdens caused by volatility changes, making it suitable for capturing the uptrend after a breakout. Another option is $UBTENCT@EC2606A.C (14490.HK)$ , also with an exercise price of HKD 500.5, offering similarly low implied volatility and providing purer upside leverage.
For those bearish on a price pullback or looking to hedge, out-of-the-money put warrants can be considered. $JPTENCT@EP2608B.P (27020.HK)$ The exercise price is HKD 428.68, with the lowest implied volatility among similar products and higher leverage, effectively improving capital efficiency for bearish strategies. $UBTENCT@EP2608B.P (26702.HK)$ The exercise price is also HKD 428.68, with both its premium and implied volatility at the lowest levels, offering relatively stronger downside protection.
If investors believe that the stock price will rebound after stabilizing at a key support level, they can consider bull certificate products.$HS#TENCTRC2608Z.C (67017.HK)$The call price is 465 yuan, offering relatively high leverage, suitable for aggressive positioning.$UB#TENCTRC26074.C (58807.HK)$The call price is also 465 yuan, with relatively high leverage as well, serving as a short-term tool to capture technical rebounds.
On the other hand, if it is expected that the stock price will retreat after encountering resistance, bear certificate products can be considered.$JP#TENCTRP2810H.P (61823.HK)$The call price is 538 yuan, with the highest actual leverage in its category and lower premium, enabling efficient deployment for bearish strategies.$SG#TENCTRP2812S.P (62503.HK)$The call price is also 538 yuan, with the lowest premium and relatively high actual leverage, providing a cost-effective bearish option.
Do you think Tencent's current short-term rebound will break through the first resistance level at 518 yuan? At this position, would you choose to accumulate Tencent's call warrants at a low point or wait for a breakout above the resistance before entering?
Feel free to share your insights in the comment section. For more market analysis, please continue following ‘Hong Kong Stock Warrants Jenny’ for daily updates!
Reminder: This article does not constitute any investment advice.
This article is for reference only and does not constitute any investment advice. The market data, opinions, and analysis contained herein may change at any time without prior notice. We are not responsible for any loss or damage caused by reliance on the information in this article. Technical analysis only shows whether certain technical conditions are met; a comprehensive assessment of asset performance should be conducted using additional data. Decisions to trade should not be based solely on this article. Please note that past performance is not indicative of future results.
#HKStocks #Real-TimeAnalysis #WarrantSelection #WarrantGuide #DerivativesHedging #HKWarrantsJenny #TencentHoldings #00700 #TechStocks #TechnicalAnalysis
Risk Disclaimer: The above content only represents the author's view. It does not represent any position or investment advice of Futu. Futu makes no representation or warranty.Read more

Comments
to post a comment
1