

Dividend Income Made Easy: August Dividend Season Arrives, Yields Up to 21%

March 31 [HK Stocks Podcast] Part 1 - Hang Seng Index, Agricultural Bank, HSBC,
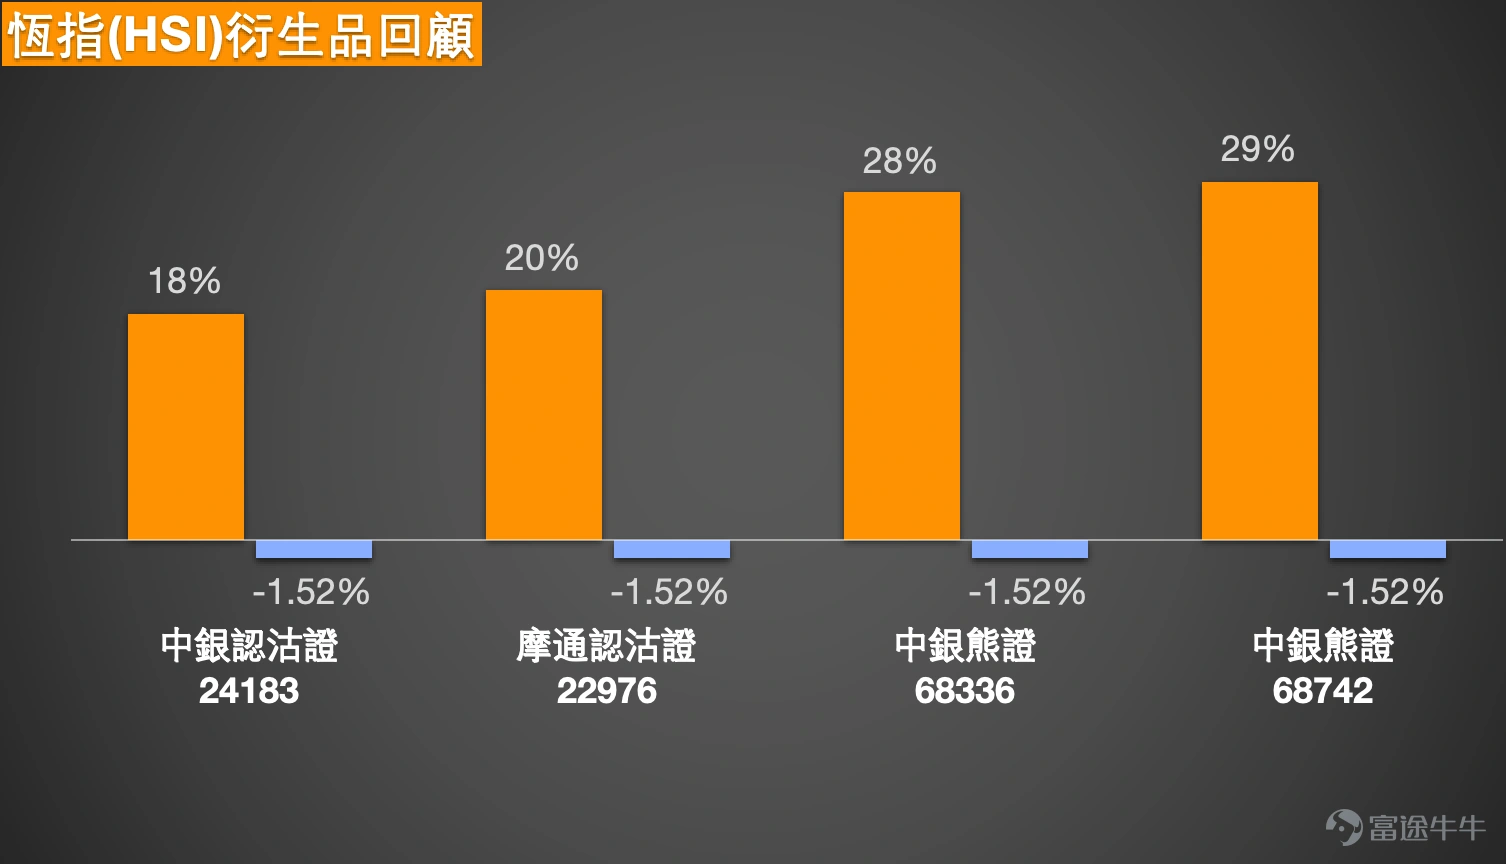
1. Hang Seng Index: Investors holding bullish warrants overnight stated a recovery price at 24,500 points, expecting it to rise to 25,000 points tomorrow. Bearish investors chose bearish warrants with a recovery price of 25,400 points overnight, believing it will drop to 24,300 points.
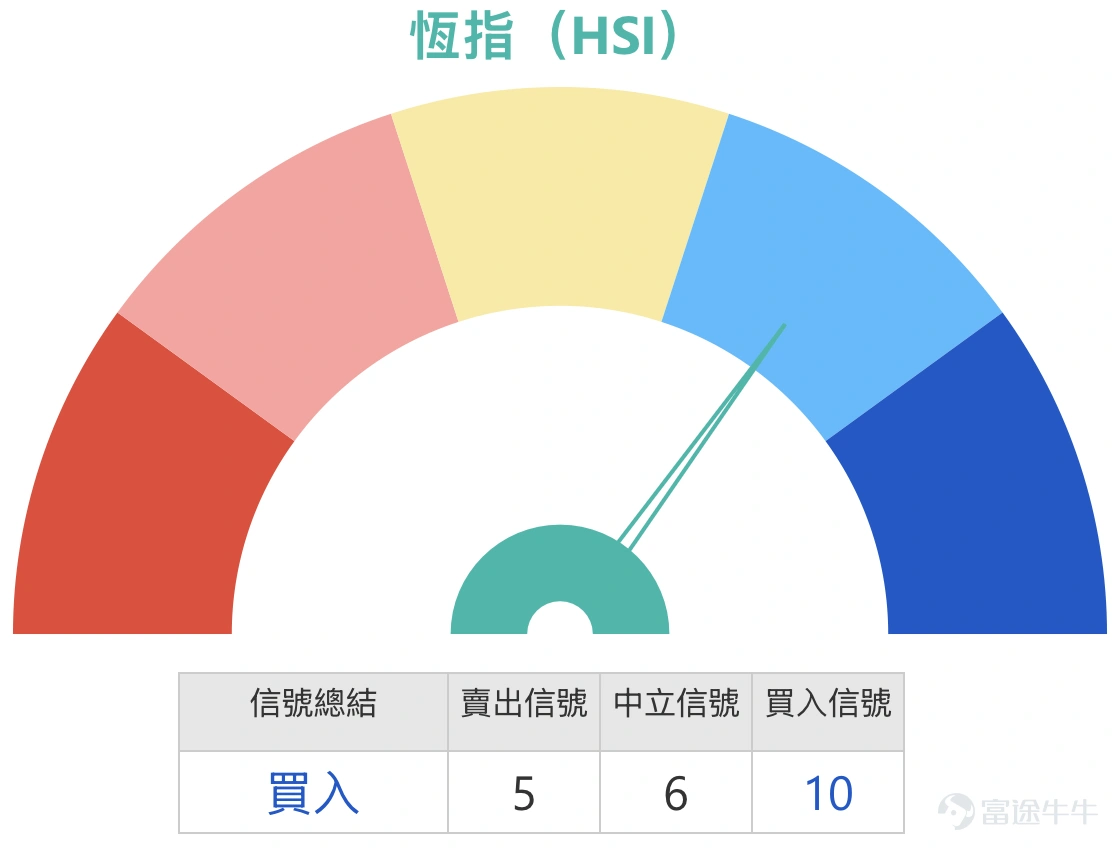
The current price of the Hang Seng Index is 24,788.14 points. The most obvious short-term trading range is between 24,203.54 points and 28,056.10 points, with an overall volatility of approximately 15.9%. Looking closer at the next one or two trading days, the area around 24,200 points is already a clear near-term low. The nearest resistance above is at the 25,000-point mark, followed by the range between 25,400 and 25,500 points, beyond which there may be opportunities to challenge higher rebound pressures. The current position is in the lower-middle part of the rebound from the lows, indicating that the market has not yet truly shaken off its weakness but remains in a tug-of-war at the lower end.
In terms of technical conditions, the moving averages are still trending downward, reflecting that the major trend has not reversed; the relative strength index remains at a weak level without any clear signs of recovery. The Bollinger Bands are close to the lower band, showing signs of narrowing, indicating that while the downtrend has not fully dissipated, the short term has entered a sensitive zone awaiting a breakout or another test lower. The key point of this structure is not to fantasize about a one-sided move, but rather to watch whether critical levels will be effectively broken through or lost.
If we look at the upside, the trigger condition is very clear: the index must first stabilize above 24,800 points tomorrow, and further break through to 25,000 points, ideally closing above this key level, in order to open up the potential for a rebound. If it only briefly touches 25,000 points during the session but fails to hold steady, or quickly retreats, this would only qualify as a technical rebound and would not confirm a strengthening trend. In other words, for the bulls to win, the key is not just reaching 25,000 points, but staying above 25,000 points.
In terms of downside risk, the triggering conditions are equally straightforward: if the support level between 24,700 and 24,500 points is clearly broken, especially if 24,500 is breached, the market will again test the recent low of 24,203.54 points, making the bearish target of 24,300 points more realistic. Therefore, the most dangerous position at the moment would be holding bullish certificates overnight with a call price close to 24,500 points. This isn't just about directional risk; the forced redemption risk has become extremely high, almost amplifying normal short-term fluctuations into elimination risks.
In terms of capital distribution, the regions with the highest trading concentration for bull and bear certificates are mainly between 24,000 and 24,499 points for bull certificates, while bear certificates concentrate between 25,000 and 25,499 points. The over-the-counter (OTC) inventory structure closely mirrors this pattern, with bull certificates mostly clustered around 24,000 to 24,499 points, while bear certificates focus on 25,000 to 25,999 points. This reflects that market funds aren't betting in one direction but are clearly split into two opposing sides. There are bullish positions betting on a rebound below, and bearish positions expecting a pullback above, forming a typical tug-of-war pattern between support and resistance. In other words, the market isn’t unanimously bullish or bearish; both sides are placing bets in the near-price zones.
In response to investor inquiries, holding bull certificates overnight with a call price of 24,500 points and expecting the index to rise to 25,000 points tomorrow is not entirely impossible in terms of direction, but the strategy is aggressive and carries excessive risk because the current price is too close to 24,500 points. If there’s any early weakness, the product itself would face significant pressure. While this view has some logic, the safety margin of the chosen instrument is insufficient. As for bearish investors holding bear certificates with a call price of 25,400 points who believe the market will fall to 24,300 points, this scenario logically has more room to develop compared to the bull side since 25,400 points remain within the recent resistance zone. Unless the index stabilizes above 25,000 points, a retest of 24,500 or even 24,200 points isn't out of the question. However, 24,300 points are already near the recent lows, so while downward potential exists, it won’t drop without resistance. Therefore, although the expected value of this bet is slightly higher than the 24,500-point bull certificate, it also cannot be considered a sure win in a one-sided move.
Overall, the short-term risk-reward ratio currently leans slightly towards testing lower levels after facing pressure at higher levels, but the advantage is not one-sided. The real key remains whether 25,000 points can hold steady, and whether 24,500 points will be breached. In such a narrow market, directional judgment can be made, but if the recovery price for overnight positions is too close, the risk-reward ratio will be significantly reduced by the recovery risk. $BI-HSI @EP2606B.P (24183.HK)$$JP-HSI @EP2605A.P (22976.HK)$$BI#HSI RP2804S.P (68336.HK)$$BI#HSI RP28049.P (68742.HK)$
2. Agricultural Bank of China (01288.HK): Investors expressed they will sell tomorrow, hoping for over 6 yuan. Holding call warrants with an exercise price of 6.68 yuan.
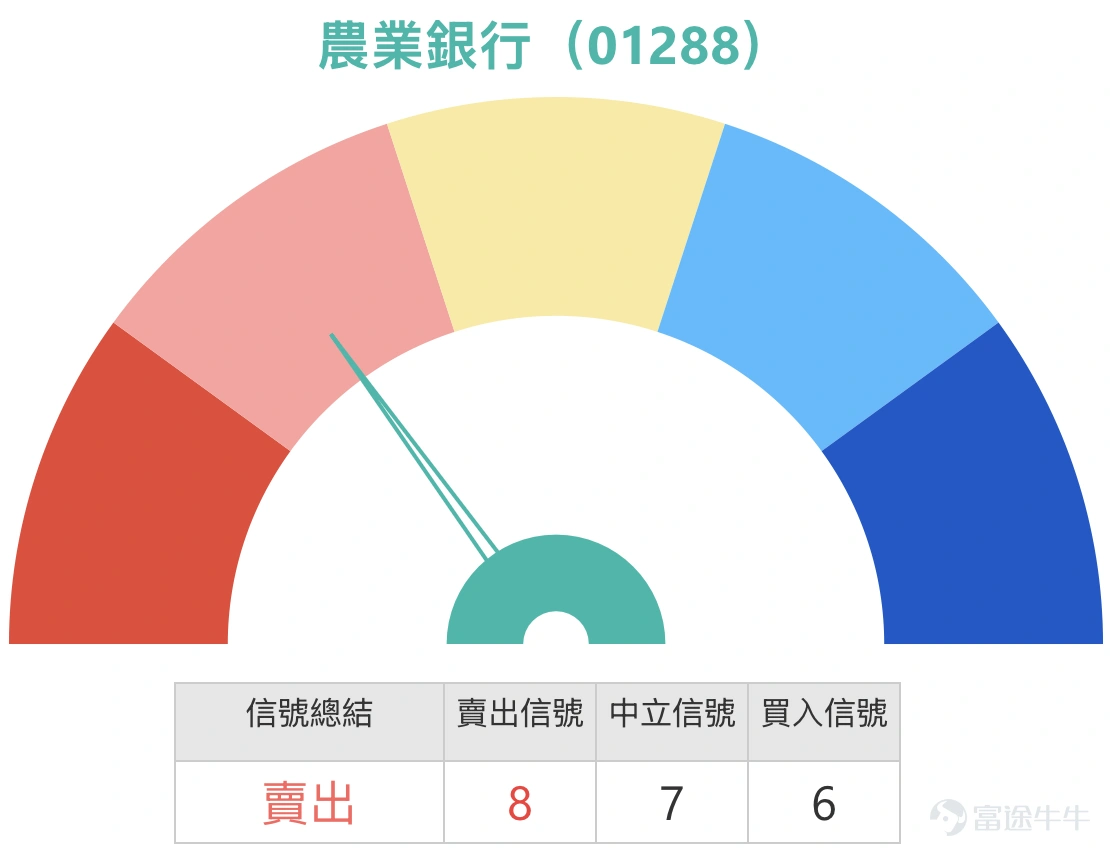
Agricultural Bank of China's current price is 5.57 yuan, and the short-term obvious trading range can first look at 5.08 yuan to 5.69 yuan, with an overall fluctuation of about 12.0%. From the current price position, the stock has clearly rebounded from recent lows and is approaching the upper limit of the range again, reflecting increased short-term buying power. Immediate support can be seen around 5.52 yuan to 5.50 yuan, which is close to short-term moving averages and recent consolidation areas. Further down, the 5.39 yuan to 5.32 yuan region is critical, and if it breaks below this, caution should be exercised as it may retest the recent low of 5.08 yuan. On the resistance side, first look at 5.69 yuan, the recent clear high point. If it breaks through, the next step could push towards the psychological 6-yuan mark. So, the short-term focus is very clear: whether the stock can break above the top of the range and open up further upside space.
From a technical perspective, the moving averages are currently entangled but showing signs of improvement, indicating that the medium- to short-term trend is gradually strengthening from consolidation but hasn’t fully entered a strong one-sided uptrend yet. The relative strength index is in a relatively strong state and has risen to higher levels, reflecting decent short-term momentum but also suggesting the stock isn't at a low anymore. Regarding Bollinger Bands, the price is nearing the upper band, indicating a strong short-term trend. However, it also means that if it fails to break further, consolidation or pullbacks near the upper band might occur.
For upside potential, the trigger condition is clear: the stock price must effectively break above the recent high of 5.69 yuan, and ideally, it shouldn’t just briefly pierce through during intraday trading but stabilize above it. Only then does the psychological 6-yuan mark gain practical short-term relevance. If the price merely approaches 5.69–5.70 yuan before facing resistance again, it indicates selling pressure persists, and 6 yuan might not be reached in the very short term. In other words, to see 6 yuan, we need to witness a break above 5.69 yuan and stabilization above it.
Regarding downside risk, the trigger condition would be if the stock price falls back below the support near 5.50 yuan, especially if it breaches the recovery zone between 5.39 and 5.32 yuan. This would indicate weakening rebound momentum, leading the market to retest lower levels, with short-term expected value noticeably declining. Therefore, despite the current strong trend, if the breakout at higher levels fails and strong indicators retreat, those chasing the uptrend should beware of rapid pullbacks.
In terms of warrant capital distribution, there are currently 11 related products on the market, all of which are call warrants, with no put warrants, reflecting a highly concentrated market direction. The most traded range is between exercise prices of 6.68 and 6.69 yuan, while OTC inventory concentrates around the 7.61 yuan exercise price. This structure shows that short-term capital primarily focuses on near-the-money to moderately out-of-the-money call deployments, while OTC inventory accumulates around higher exercise prices. It demonstrates that the overall market sentiment leans strongly bullish, showing consistency rather than divergence between bulls and bears, with a clear bias toward one-sided optimism.
In response to investors' questions, aiming for above 6 yuan tomorrow is not entirely illogical. The current stock price is indeed near the upper end of the rebound range, and market derivatives are clearly leaning bullish. The call warrant you hold, with a strike price of 6.68 yuan, falls within the most actively traded mainstream region, indicating it's not an unpopular choice. However, expecting the price to exceed 6 yuan directly by tomorrow is quite ambitious because it first needs to confirm a valid breakout above 5.69 yuan; otherwise, 6 yuan remains a target rather than an activated level. Your held call warrant with a strike price of 6.68 yuan is still out-of-the-money, meaning if the underlying stock only rises slightly, the product’s reaction might not be very favorable. Therefore, while the direction seems reasonable, the time expectation is somewhat aggressive. In terms of short-term betting value, if the stock price can break through and stabilize above 5.69 yuan, the probability of reaching 6 yuan would significantly improve. If it fails to break through, taking profits early could be a more practical short-term strategy.
3. HSBC Holdings (00005.HK): Is there any chance of breaking below 120? Investors have chosen Put options, targeting a drop to 110.
HSBC Holdings is currently trading at HKD 125.80. Its recent range can be seen between HKD 118.50 and HKD 144.48, with an overall fluctuation of about 21.9%. From a short-term trading perspective, the stock price is currently in the middle-to-lower part of the range and is still consolidating after bouncing from its lows. Immediate support can be found around HKD 124 to HKD 123.30, near recent sideways movement. Below that is the HKD 120 to HKD 118.50 zone, where HKD 120 is a significant psychological threshold, and HKD 118.50 marks a recent clear low. Resistance levels can be identified first around HKD 127.80 to HKD 129, as this area is near several medium- and short-term moving average pressures. Further up, the HKD 131 to HKD 132.50 zone comes into play. Therefore, the current focus is straightforward: whether the stock price can first break through the upper moving average band or retreat again to test the HKD 120 edge.
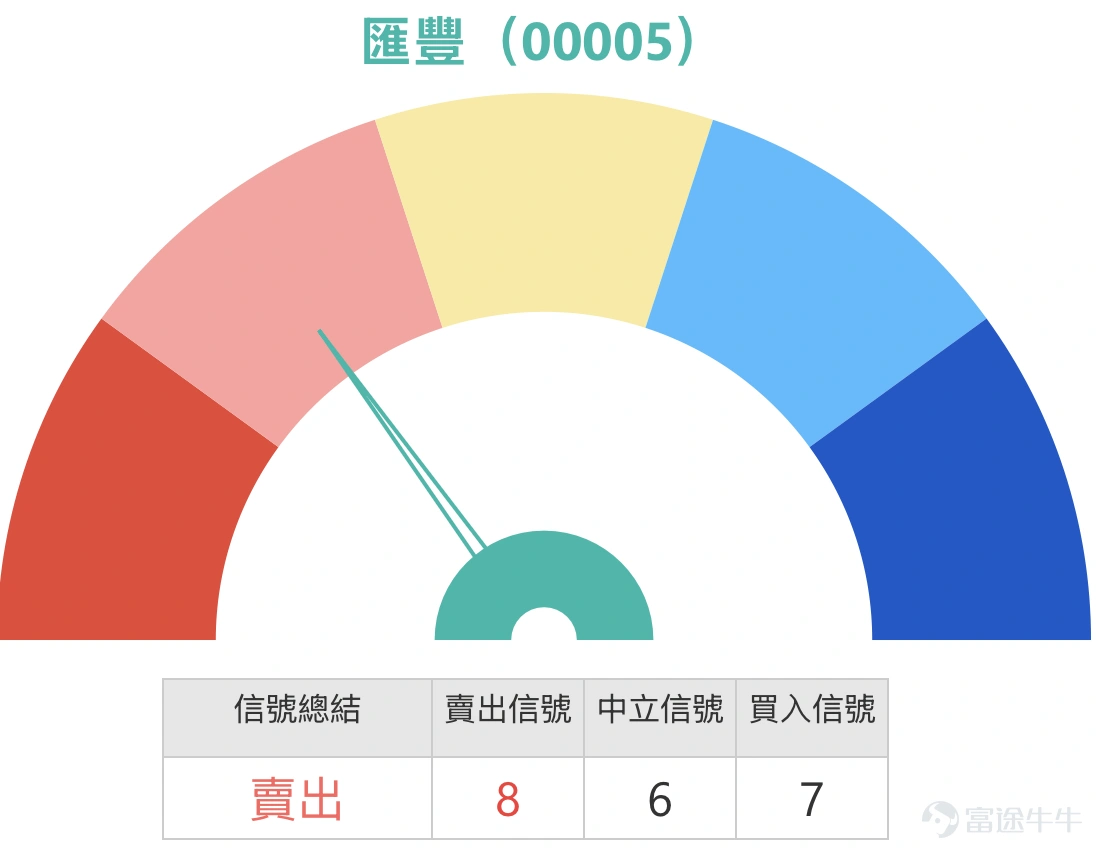
Technically, the moving averages are currently intertwined, reflecting that neither a clear short-term nor mid-term trend has formed. The situation resembles a sideways consolidation awaiting a breakout. The Relative Strength Index (RSI) is at a neutral level, suggesting balanced buying and selling pressures—neither entering a strong zone nor showing extreme weakness. The Bollinger Bands show signs of narrowing, with the price near the middle band, indicating temporary contraction in volatility as the market awaits a new directional signal. Such patterns usually do not favor prematurely assuming a sharp decline or rise but require confirmation through a decisive breakout before clarity emerges.
For an upward view, the trigger condition is clear: the stock price must first break through the resistance zone between 127.80 yuan and 129 yuan, preferably with continuous stability, to advance further towards 131 yuan to 132.50 yuan. A slight intraday rise without solid footing merely indicates a rebound within the range, insufficient to confirm short-term strength. In other words, only a genuine breakout above the moving average pressure zone will create noticeable continuation potential for a short-term uptrend.
For downside risk, the trigger condition is a re-breakdown below support near 123 yuan, especially if the psychological threshold of 120 yuan is breached, which would open the path to testing the recent low of 118.50 yuan. If 118.50 yuan also breaks, the market will likely shift its target lower. Only then would the 110-yuan target transform from an aggressive view to a plausible extended objective. Thus, 120 yuan is not a trivial level to ignore but a critical inflection point determining whether the short-term structure weakens.
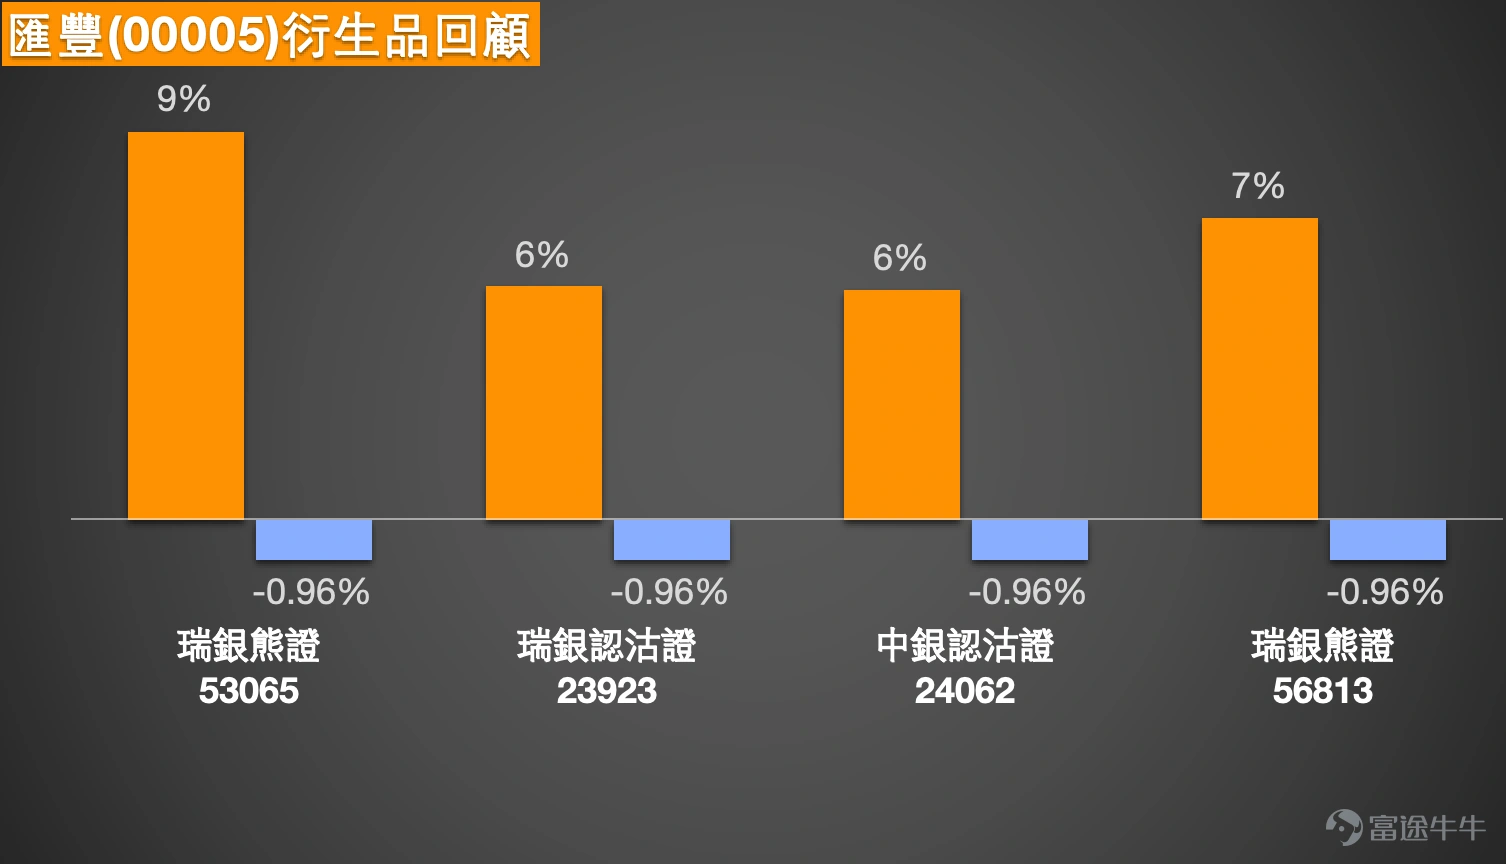
Regarding capital flow data, the most concentrated trading range for call warrants is between strike prices of 145 yuan to 149.99 yuan, while for put warrants, it is between 110 yuan to 114.99 yuan. Street-level distribution shows that call warrants are heavily concentrated around the 85 yuan to 89.99 yuan strike price, whereas put warrants concentrate more around the 90 yuan to 94.99 yuan and 100 yuan to 104.99 yuan ranges. This structure reveals simultaneous upward and downward deployments on the short-term trading layer. Notably, put warrant concentration is visibly around 110 yuan, indicating some capital is betting on deeper declines. Nevertheless, with 100 call warrants versus 54 put warrants, the market isn't uniformly bearish, and street-level distributions aren’t one-sided. Hence, the current derivatives market reflects divergence rather than unanimous bearishness.
To directly address investors' concerns, breaking below HKD 120 is not impossible, but it’s not yet a high-probability event at this stage. The stock is still within its consolidation range, and technical indicators remain neutral to slightly cautious without showing clear signs of accelerated weakness. Investors choosing Puts targeting HKD 110 reflect an aggressive view; only after clearly breaching HKD 120 and failing to hold above HKD 118.50 would the HKD 110 target gain more credibility. If HKD 120 holds, the risk-reward ratio of Puts will quickly decline and could easily weaken returns due to time decay. Simply put, while considering a drop below HKD 120 is reasonable, directly aiming for HKD 110 at this stage represents a forward-looking strategy. For now, the short-term risk-reward ratio isn’t particularly skewed toward a unilateral downside. A better opportunity to consider bearish positions would be confirming a breakdown below HKD 120 rather than assuming a direct fall to HKD 110 based solely on the current price. $UB#HSBC RP2702C.P (53065.HK)$$UB-HSBC@EP2609B.P (23923.HK)$$BI-HSBC@EP2609A.P (24062.HK)$$UB#HSBC RP2701B.P (56813.HK)$
Reminder: This article does not constitute any investment advice.
This article is for reference only and does not constitute any investment advice. The market data, opinions, and analysis contained herein may change at any time without prior notice. We are not responsible for any loss or damage caused by reliance on the information in this article. Technical analysis only shows whether certain technical conditions are met; a comprehensive assessment of asset performance should combine other data and should not solely rely on this article to make trading decisions. Please note that past performance is not indicative of future results. Follow Jenny's insights on Hong Kong stock warrants for more professional analysis.
Risk Disclaimer: The above content only represents the author's view. It does not represent any position or investment advice of Futu. Futu makes no representation or warranty.Read more

Comments
to post a comment
1
11