

Mixed performance in the semiconductor sector: How significant are SMIC's technical bottoming signals?
The stock price has weakened recently, hitting a near-term low of 49.32 yuan yesterday (30th). Today (31st), it rebounded from a low of 50.8 yuan, reaching an intra-day high of 52.9 yuan. Currently, the bulls and bears are in a tug-of-war. The current price remains significantly below the 10-day moving average of 56.31 yuan and has consecutively fallen below the 30-day line at 62.5 yuan and the 60-day line at 68.45 yuan. Technically, the stock is trading below all major moving averages, showing a clear bearish pattern with a short-term downward trend. However, amidst the bleak market conditions, several key technical indicators are simultaneously signaling strong oversold conditions and potential reversal signals, which merit close attention from professional investors.
In-depth analysis of oscillation indicators suggests that extreme market pessimism may be nearing an end. The Relative Strength Index (RSI) is currently at 26, deep within the traditionally recognized oversold region, indicating that selling pressure may have been overextended. More importantly, the Stochastic Oscillator (KD) and Williams %R also confirm that the market is severely oversold, signals that often precede exhaustion of bearish momentum and foreshadow a technical rebound. Meanwhile, the Commodity Channel Index (CCI) has issued a clear 'buy' signal, further strengthening the possibility that a short-term bottom is forming. Additionally, analyses of momentum oscillators and bull/bear power indicators also suggest the stock is 'severely oversold and potentially bottoming out,' providing additional support for the 'buy' perspective.
In terms of key price levels, the primary support is at 47.9 yuan; if this level is breached, the next critical defense will shift down to 41.3 yuan. On the upside, the first target for the rebound is 57.3 yuan, close to the current 10-day line, where initial profit-taking pressure is expected. If it can successfully break through, the next key resistance will be at 63.8 yuan.
Overall, although SMIC’s daily chart structure remains weak, with the stock trading below all moving averages, trend tools such as the Moving Average Convergence Divergence (MACD) and Bollinger Bands still indicate downside pressure. However, what cannot be ignored is that market sentiment has reached an extreme, and multiple oscillators measuring momentum and overbought/oversold conditions have issued rare synchronized 'buy' signals—especially the combination of RSI, Stochastic Oscillators, and CCI—which suggest the probability of a technical rebound is increasing significantly. For professional investors skilled at capturing market turning points, the current price already holds value for a short-term rebound play. Consider using 47.9 yuan as a key stop-loss reference and set the initial rebound target around 57.3 yuan. However, it must be remembered that this expectation is based solely on a technically oversold rebound; if subsequent trading volume does not cooperate or overall market sentiment remains sluggish, the strength of the rebound may be limited.
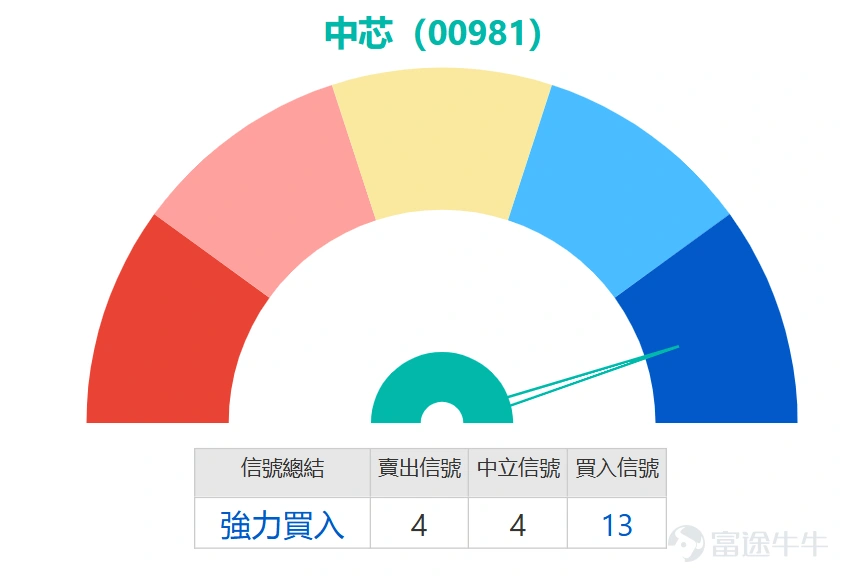
SMIC's current technical indicators summarize as a 'strong buy,' with a technical indicator signal strength of 13; as for other semiconductor stocks... $HUA HONG GRACE (01347.HK)$ The technical indicator summary is 'Buy', with a signal strength of 11; $SHANGHAI FUDAN (01385.HK)$ The technical indicator summary is 'Buy', with a signal strength of 9; $ASMPT (00522.HK)$ The technical indicator summary is 'Neutral', with a signal strength of 9.

Historical data from March 25, 2026 shows that SMIC (00981) recorded a 7.08% decline two days later. Derivative products in the corresponding short direction rose sharply across the board, with some showing notable increases: $SG#SMIC RP2812G.P (68523.HK)$ Up 36%, $UB#SMIC RP2812E.P (69150.HK)$ Up 33%, $BI-SMIC@EP2610A.P (26641.HK)$ Up 30%.

As SMIC's share price repeatedly searched for a bottom, the open interest in derivative products showed clear signs of capital positioning, corroborating the oversold signals on the technical side. The open interest in call warrants steadily increased, rising from 1810.55 million units on March 26 to 1841.39 million units by March 30, recording growth over two consecutive trading days, reflecting bullish funds gradually entering the market to establish positions early. In contrast, the open interest in put warrants slowly retreated, dropping slightly from 335.86 million units to 331.1 million units, indicating that market expectations for further declines have eased.
In terms of bull and bear certificates, there was even more active capital flow. The open interest in bull certificates first rose then fell, surging by 33.89 million units in a single day on March 27 to reach 127.75 million units, demonstrating bargain-hunting funds entering aggressively amid the stock price adjustment. Although it retreated to 109.8 million units on March 30, it still showed a significant increase compared to the level on March 26. The open interest in bear certificates initially decreased before increasing, remaining within a range of 67-75 million units, with no significant expansion of bearish forces. Overall, the structure of open interest indicates that as SMIC continues probing lower levels, the market’s willingness to go long is gradually accumulating, and medium-to-long term funds’ expectations for a rebound are continuously rising.
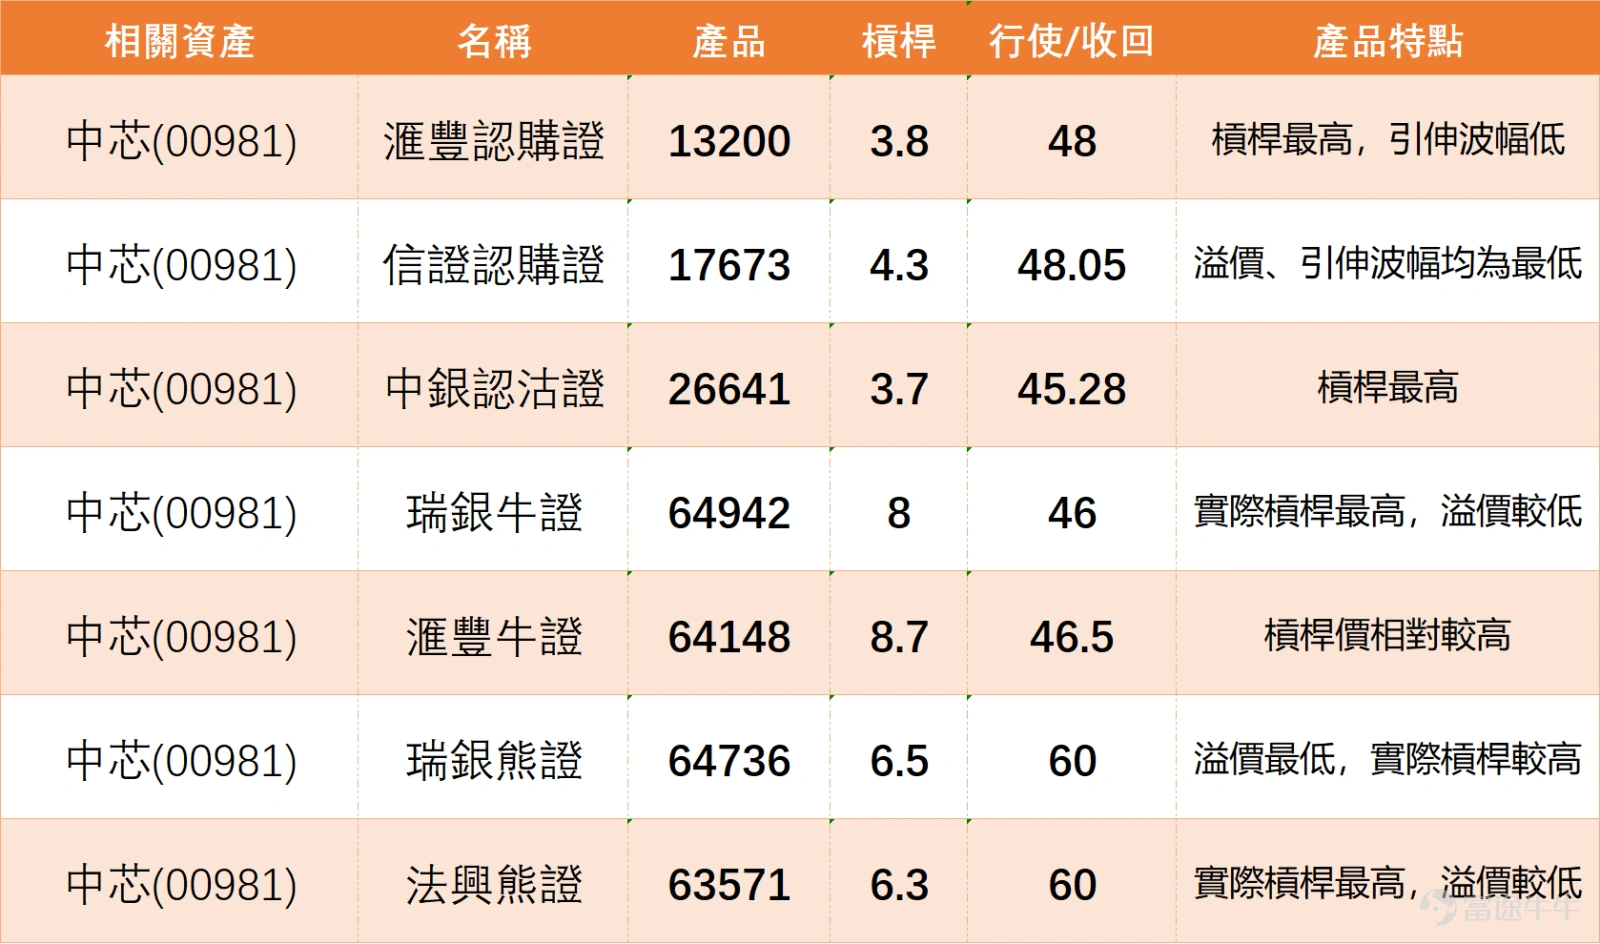
For call warrants, $HS-SMIC@EC2608A.C (13200.HK)$ The exercise price is HKD 48, offering approximately 3.8x leverage. Its distinguishing feature is that the leverage level is the highest among similar products, with relatively low implied volatility, making it suitable for investors who are optimistic about SMIC's future performance and wish to participate with lower volatility costs. Another option is $CI-SMIC@EC2608A.C (17673.HK)$The strike price is 48.05 yuan, offering leverage of approximately 4.3 times. This product has the lowest premium and implied volatility in the market, effectively reducing time decay, making it suitable for medium-term bullish strategies.
For put warrants, $BI-SMIC@EP2610A.P (26641.HK)$The strike price is 45.28 yuan, with leverage of about 3.7 times, making it the highest leveraged put option currently available. It is suitable for investors expecting SMIC's share price to face a correction and who want to capture downside opportunities with higher leverage.
For bull certificates, $UB#SMIC RC2609C.C (64942.HK)$The redemption price is 46 yuan, providing actual leverage of around 8 times. Its key feature is that it offers the highest actual leverage among similar products and comes with a relatively low premium, making it ideal for aggressive, optimistic investors.$HS#SMIC RC2610A.C (64148.HK)$The redemption price is 46.5 yuan, with actual leverage of approximately 8.7 times. The leverage level is relatively high, offering greater price sensitivity, and is suitable for investors with strong confidence in SMIC’s short-term performance.
In terms of bear certificates,$UB#SMIC RP2812F.P (64736.HK)$The redemption price is 60 yuan, with actual leverage of about 6.5 times. Its premium is the lowest among similar products, while its actual leverage is relatively high, making it suitable for investors who are bearish on the market and want to hedge risks at a lower cost.$SG#SMIC RP2812T.P (63571.HK)$The redemption price is also 60 yuan, with actual leverage of about 6.3 times, making it the highest-leveraged bear certificate available, along with a relatively low premium. It is well-suited for capturing downward momentum during a pullback in SMIC's stock price.
New stocks $FOURSEMI (03625.HK)$ Opening nearly 113% higher on the first day, do you think it can drive a recovery in semiconductor stocks? Feel free to share your insights in the comment section.
For more market analysis, stay tuned to Jenny's daily updates on 'Hong Kong Stock Warrants'!
Reminder: This article does not constitute any investment advice.
This article is for reference only and does not constitute any investment advice. The market data, opinions, and analysis contained herein may change at any time without prior notice. We are not responsible for any loss or damage caused by reliance on the information in this article. Technical analysis only shows whether certain technical conditions are met; a comprehensive assessment of asset performance should be conducted using additional data. Decisions to trade should not be based solely on this article. Please note that past performance is not indicative of future results.
#Hong Kong stocks #Real-time analysis #Warrants selection #Warrants strategy #Derivatives hedging #Hong Kong stock warrants Jenny #SMIC #00981 #Technology stocks $Hang Seng Index (800000.HK)$$Hang Seng TECH Index (800700.HK)$
Risk Disclaimer: The above content only represents the author's view. It does not represent any position or investment advice of Futu. Futu makes no representation or warranty.Read more

Comments (2)
to post a comment
3