Is a rebound imminent for SMIC (00981) after a sharp decline? The battle for key levels will determine the future direction.
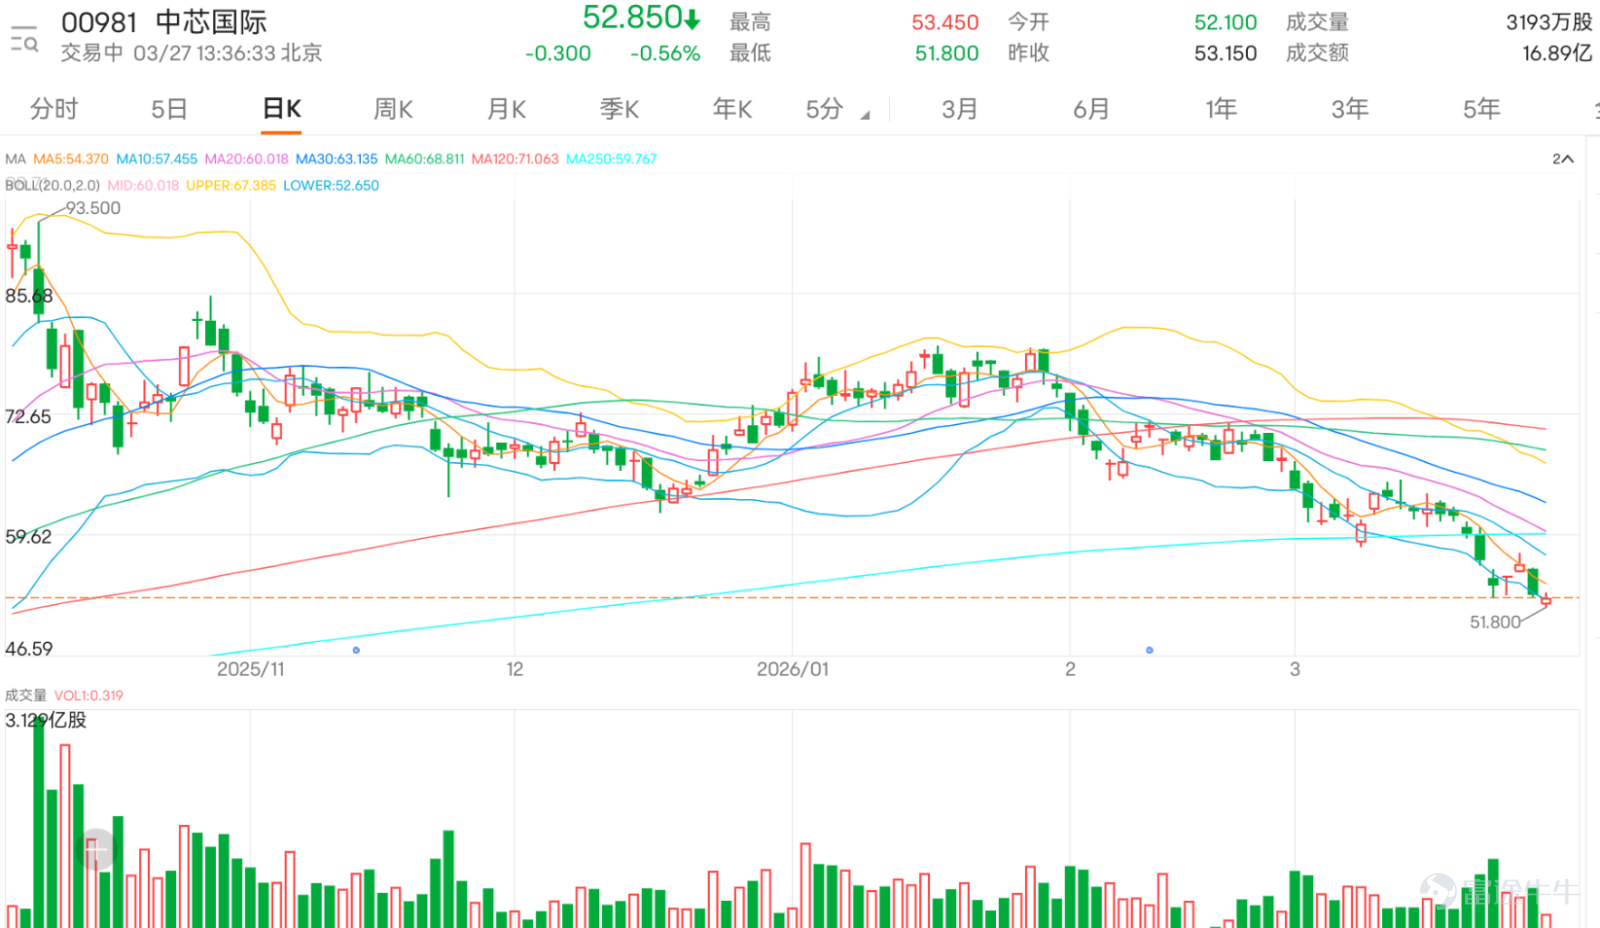
$SMIC (00981.HK)$ The stock has remained weak post-earnings, hitting a low of HKD 51.8, the lowest level since September 2025. Observing the current trend, SMIC's share price remains under pressure and has clearly broken below all major moving averages, including the 10-day line (HKD 57.44), the 30-day line (HKD 63.13), and the 60-day line (HKD 68.81). These moving averages are in bearish alignment, forming layered resistance above and confirming that the intermediate downtrend is still dominating the market. The volatility over the past five days reached 11.2%, indicating intensified battles between bulls and bears during the decline.
However, beneath the surface of price weakness, a series of key technical indicators have issued strong oversold and potential reversal signals. Both the Stochastic Oscillator (KDJ) and the CCI indicator have clearly issued buy signals, suggesting that downward momentum may be overly exhausted in the short term, creating demand for technical recovery. The crucial RSI indicator has dropped to 29, entering the widely recognized "oversold" zone, which is typically seen as a technical warning sign of excessive market pessimism, increasing the probability of a stock price rebound. Additionally, momentum oscillators and bull-bear power indicators also suggest that the market might be brewing a bottom formation.
However, investors must treat these rebound signals with caution. Trend indicators such as MACD remain in sell mode, and the ADX indicator shows that the current downtrend has certain strength. This means any rebound will first need to face significant moving average resistance above. Key price zones are now clear: the first support level below is at HKD 49.9. If this level fails, there could be further downside towards the second support at HKD 44.2. On the rebound side, HKD 58.1 will be the first important test, near the 10-day moving average; if it breaks through, it could aim higher toward the HKD 64.8 pressure zone.
In summary, while SMIC’s intermediate-term trend remains weak, the short-term picture has become severely oversold, and conditions for a technical rebound are accumulating. The current price level is not suitable for blindly chasing downside bets. In terms of strategy, focus on the stock’s performance within the critical range of HKD 49.9 to HKD 58.1. If the price stabilizes around HKD 49.9 with supporting trading volume, combined with multiple oscillator buy signals, this could present a short-term rebound trading opportunity, with an initial target at the HKD 58.1 resistance level. Conversely, if the price breaks below HKD 49.9 with heavy volume, caution should be exercised against the risk of a deeper downtrend. The overall strategy should prioritize “cautious bounce plays” with strict stop-loss measures.


Looking back at March 23, 2026, over the following two days, SMIC's underlying stock cumulatively rose by 4.34%, resulting in substantial gains across all bullish derivative products. $SG#SMIC RC2611B.C (68929.HK)$ with a rise of 30%, $BP#SMIC RC2608G.C (69331.HK)$ rose by 29%, $HS-SMIC@EC2609A.C (19264.HK)$ 、 $BI-SMIC@EC2609A.C (18978.HK)$ both rising by 17%, reflecting the elastic performance of bullish leveraged products driven by the underlying stock's increase.

If investors are optimistic about SMIC’s future performance, they may consider $CI-SMIC@EC2609A.C (19093.HK)$ , which has a strike price of 62.93 yuan and an actual leverage of approximately 4.9 times. The premium and implied volatility of this warrant are at the lowest levels in the market, making it suitable for investors who want to deploy with lower costs while expecting the underlying stock to rise. Another option is $BI-SMIC@EC2609A.C (18978.HK)$ , with a strike price of 62.88 yuan and an actual leverage of approximately 4.6 times. Its leverage and implied volatility are relatively ideal, balancing cost with potential returns.
If bearish on SMIC’s trend, one can look at $CI-SMIC@EP2607A.P (20792.HK)$ , with a strike price of 52.55 yuan and an actual leverage of approximately 4.6 times. It also features the lowest premium and implied volatility in the market, suitable for defensive deployment with low-cost considerations for those bearish on the outlook. Additionally, $BI-SMIC@EP2607A.P (20088.HK)$ , with a strike price of 52.45 yuan and an actual leverage of approximately 4.3 times, its combination of leverage and implied volatility is also relatively ideal, providing another option for bearish positioning.
For investors who prefer bull contracts, $UB#SMIC RC2609C.C (64942.HK)$ , with a recovery price of 46 yuan and an actual leverage of approximately 6.3 times, is one of the highest actual leverages available in the market and comes with a relatively low premium, making it suitable for aggressive short-term bullish positions. $HS#SMIC RC2610A.C (64148.HK)$The recovery price is HK$46.5, with an actual leverage of approximately 6.7 times; it also has a relatively low premium, providing a bullish tool with higher leverage.
If you are bearish and choose bear certificates, $SG#SMIC RP2812H.P (62505.HK)$The recovery price is HK$63, with an actual leverage of about 5.7 times. This product offers the highest actual leverage and the lowest premium in its category, making it suitable for investors who are bearish on the market outlook and seeking high leverage.$HS#SMIC RP2811B.P (62952.HK)$The recovery price is HK$62, with an actual leverage of approximately 6 times. It similarly features high actual leverage and low premium, serving as an effective tool for bearish strategies.

$Semiconductor Manufacturing International Corporation (688981.SH)$Net profit surged by nearly 40% last year,$HUA HONG GRACE (01347.HK)$While net profit saw a slight decline. In your opinion, whose performance better met market expectations between the two leading chip companies? Which company's future trend do you favor? Feel free to share your insights in the comments section. For more market analysis, stay tuned to 'HK Stock Warrants Jenny' daily updates!$Hang Seng Index (800000.HK)$$Hang Seng TECH Index (800700.HK)$$Semiconductors (LIST1013.HK)$
Reminder: This article does not constitute any investment advice.
This article is for reference only and does not constitute any investment advice. The market data, opinions, and analysis contained herein may change at any time without prior notice. We are not responsible for any loss or damage caused by reliance on the information in this article. Technical analysis only shows whether certain technical conditions are met; a comprehensive assessment of asset performance should be conducted using additional data. Decisions to trade should not be based solely on this article. Please note that past performance is not indicative of future results.
#HongKongStocks #RealTimeAnalysis #WarrantsSelection #WarrantsStrategy #DerivativesHedging #HongKongWarrantsJenny #SMIC #00981 #ChipStocks #TechnicalAnalysis
Risk Disclaimer: The above content only represents the author's view. It does not represent any position or investment advice of Futu. Futu makes no representation or warranty.Read more


Comments
to post a comment
2
8