Simultaneous pressure on the Red Sea and the Strait of Hormuz drives international oil prices higher

Strong support at high oil prices: CNOOC follows the strengthening of international oil prices, challenging resistance levels.
As of March 26, 2026, CNOOC (00883) was trading at HKD 29.08, up 2.11%. From a technical perspective, the stock price has successfully rebounded from its lows and regained multiple moving averages. The energy sector in Hong Kong's stock market showed mixed performance today, with CNOOC rising along with oil prices while PetroChina (00857) $PETROCHINA (00857.HK)$ and Sinopec (00386) $SINOPEC CORP (00386.HK)$ traded within a narrow range. CNOOC, supported by its cost advantages and production growth, remained relatively resilient.
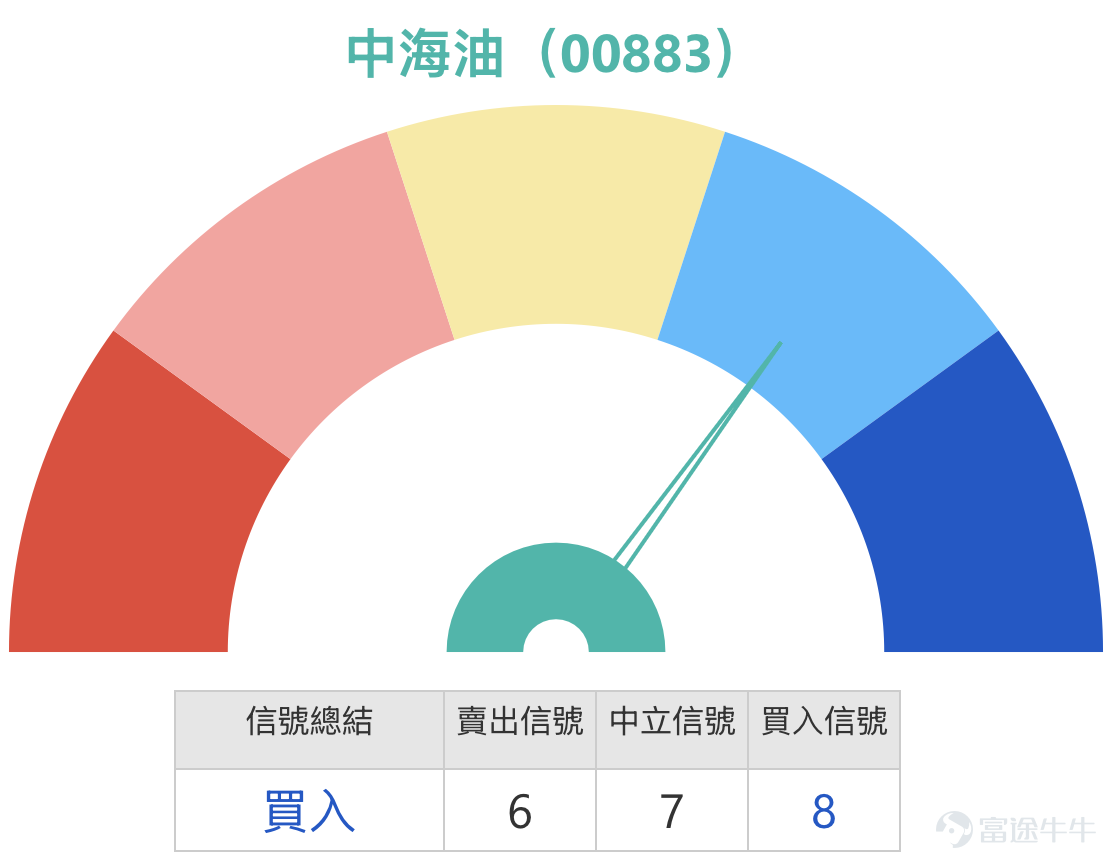
The short-term moving average MA10 is at 29.36 yuan, close to the current price, while MA30 and MA60 are located at 27.22 yuan and 24.81 yuan respectively, presenting a bullish alignment. The overall upward divergence of the moving averages reflects a strengthening mid-term trend. Based on multiple technical indicators, the system has issued a "buy" signal with a strength of 8. Several oscillation indicators such as the CCI indicator also show a "buy" signal, and both the Bull-Bear Power Indicator and Ichimoku Cloud display "buy," confirming the continuation of an uptrend. However, the MACD signal indicates "sell", and the Bollinger Bands also suggest "sell," reflecting potential short-term consolidation pressure. According to technical analysis data, short-term support levels are at 27 yuan and 25.9 yuan, while resistance levels are at 30.2 yuan and 31.9 yuan. The probability of an upward movement is 54%, with a 5-day volatility of 12.5%, indicating relatively high stock price volatility.

Reviewing the performance of the warrant market, based on the product review from March 23, the four products mentioned that day recorded significant increases over the following two days (up to March 25), successfully capturing the downward movement of the underlying stocks. In particular, HSBC Bear Certificate (58636) and UBS Group Bear Certificate (69154) recorded increases of 71%, showing the most notable performance; UBS Group Put Warrant (26838) and HSBC Put Warrant (27191) increased by 38% and 36% respectively. During the same period, the underlying stocks fell by 6.56%, demonstrating that the relevant bear certificates and put warrants effectively played their roles in hedging and capturing the decline. This shows that appropriate derivative instruments can significantly amplify returns in a clear downtrend.

Based on a combination of technical analysis and market environment, CNOOC is currently in a strong phase supported by oil prices in the short term. Investors should consider 27 yuan as a short-term defensive level and pay attention to the challenge posed by resistances at 30.2 yuan and 31.9 yuan. The bullish alignment of moving averages and trading volume indicate that there is still room for the uptrend to continue, but the appearance of a sell signal in the MACD suggests that short-term gains may need to be consolidated. Below is an analysis of several warrant and bull-bear certificate products with clearer terms, whose strike prices and stop-loss levels are closely related to technical supports and resistances:
For bullish deployment, consider UBS Group Call Warrant (23036) $UBCNOOC@EC2605A.C (23036.HK)$ and J.P. Morgan Call Warrant (22983) $JPCNOOC@EC2605A.C (22983.HK)$ . Both have exercise prices of 28.52 yuan, slightly above the current price of 28.9 yuan, representing a slightly in-the-money structure. The advantage of UBS Group Call Warrant (23036) lies in its relatively higher leverage (8.2 times); J.P. Morgan Call Warrant (22983) offers a relatively higher leverage (8.5 times), with exercise prices close to the current price, directly reflecting the volatility of the underlying stock. For those looking to deploy near the support level, consider bull certificates with stop-loss prices between 26 yuan and 26.5 yuan, such as Societe Generale Bull Certificate (56369) and UBS Group Bull Certificate (69852). The advantage of Societe Generale Bull Certificate (56369) is its high actual leverage (12.3 times) and low premium; UBS Group Bull Certificate (69852) stands out for having the lowest premium and relatively high actual leverage (10.5 times), with stop-loss prices below the first support level of 27 yuan, providing some buffer space.
For bearish deployment, consider UBS Group Put Warrant (26838) $UBCNOOC@EP2609A.P (26838.HK)$ and HSBC Put Warrant (27191) $HSCNOOC@EP2609A.P (27191.HK)$ . Both have exercise prices of 24.86 yuan, below the second support level of 25.9 yuan, representing an out-of-the-money structure. The advantage of UBS Group Put Warrant (26838) lies in its highest leverage (5.3 times) and lower premium; HSBC Put Warrant (27191) stands out for having the lowest premium and implied volatility, with leverage at 5.7 times. These are suitable for investors expecting the stock price to pull back and test supports at 27 yuan or even 25.9 yuan. For bear certificates, consider UBS Group Bear Certificate (68578) and Societe Generale Bear Certificate (68567), both with stop-loss prices at 31 yuan, slightly above the first resistance level of 30.2 yuan, representing deployments close to the resistance zone. The advantage of UBS Group Bear Certificate (68578) lies in its lowest premium and relatively high actual leverage (10.7 times); Societe Generale Bear Certificate (68567) stands out for its high actual leverage (10.7 times) and low premium, making it suitable for investors expecting the stock price to encounter resistance and retreat within the 30.2 yuan to 31 yuan resistance zone.

Overall, CNOOC remains in a strong phase supported by oil prices in the short term. Investors should use 27 yuan as the short-term bullish-bearish dividing line. If the stock price can hold above this support, it is expected to further challenge resistances at 30.2 yuan and 31.9 yuan; if it breaks down, attention should be paid to the support at 25.9 yuan. When selecting derivative products, one should balance leverage with the distance to the stop-loss/exercise prices based on one's judgment of future market direction and strength, while also considering the impact of international oil price fluctuations on the stock price.
Interactive Questions
Do you think CNOOC (00883) can break through the resistance level of 30.2 yuan in the short term?
A. Yes, high oil prices support the stock price
B. No, technical resistance and profit-taking pressure
Friendly reminder: This article does not constitute any investment advice. It is for reference only and does not constitute any form of investment recommendation. The market data, opinions, and analysis contained herein may change at any time without prior notice. We assume no responsibility for any loss or damage caused by reliance on the information in this article. Technical analysis only shows whether certain technical conditions are met; a comprehensive evaluation of asset performance should be conducted using additional data. Trading decisions should not be made solely based on this article. Please note that past performance is not indicative of future results. Follow Jenny's Warrants HKEX column for more professional insights.
#CNOOC #00883 #TechnicalAnalysis #SupportLevel #ResistanceLevel #Warrants #BullBearCertificates #CallOptions #PutOptions #HongKongWarrantsJenny
Risk Disclaimer: The above content only represents the author's view. It does not represent any position or investment advice of Futu. Futu makes no representation or warranty.Read more

Comments
to post a comment
5