
Review of JD.com Warrants: BOC Call Warrants Surge 33% in Two Days, Capturing the Underlying Stock's Rebound
As of March 26, 2026, JD.com (09618) was trading at HKD 113.7, up 1.07%. It touched an intraday high of HKD 116.3, with a turnover of HKD 1.19 billion, indicating active market trading.
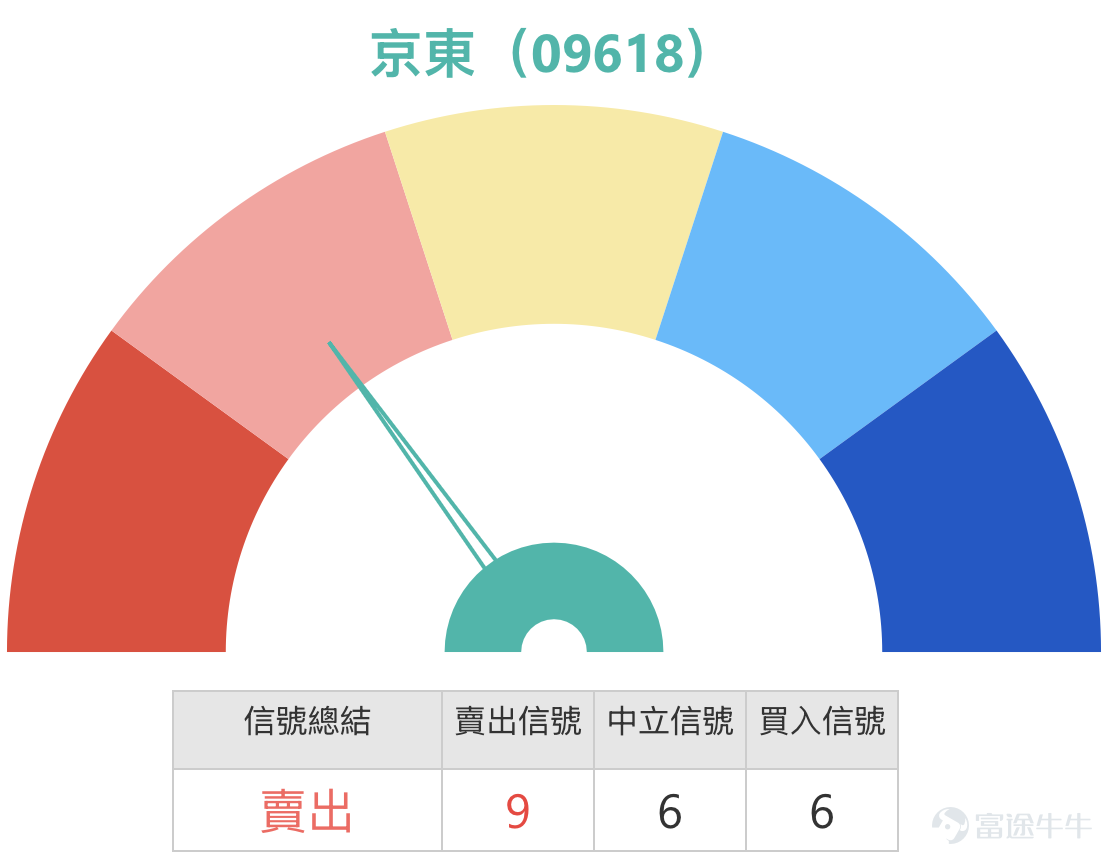
From a technical perspective, after rebounding from the low, the stock price has successfully recaptured multiple moving averages. The short-term MA10 is at HKD 110.39 and has stabilized significantly. Meanwhile, MA30 and MA60 are located at HKD 107.09 and HKD 110.07 respectively, forming a bullish alignment, reflecting strengthening short-term momentum. Combining various technical indicators, the system has issued a 'Sell' signal with a strength of 9. Multiple oscillators like the Williams %R and Stochastic Oscillator indicate 'Overbought, Sell Signal,' while the CCI indicator also suggests 'Top Divergence, Sell,' implying that the recent rise has been steep and entered overbought territory, potentially leading to consolidation pressure. However, Bull-Bear Power, Ichimoku Cloud, and MACD signals all suggest 'Buy,' and Bollinger Bands also show 'Buy,' confirming the continuation of the uptrend.
According to technical analysis data, near-term support levels are at HKD 108.6 and HKD 102.8, while resistance levels are located at HKD 117.6 and HKD 122.6. The probability of an upward move is 51%, with a 5-day volatility of 11.2%, indicating relatively high stock price fluctuations.

Reviewing the performance of the warrant market, according to the product review on March 24, the mentioned BOC call warrant (26757) $BIJDCOM@EC2609B.C (26757.HK)$ recorded a significant increase of 33% over the following two days (up to March 26), while the underlying stock rose by 6.25%. The relevant call warrants fully demonstrated the leverage effect, showing that appropriate derivatives can effectively amplify returns in a clear rebound trend.

For bullish strategies, consider the Huatai call warrant (22618) $HUJDCOM@EC2606A.C (22618.HK)$ and the BOC call warrant (22826) $BIJDCOM@EC2606B.C (22826.HK)$ . Their exercise prices are 122 yuan and 122.1 yuan respectively, slightly above the second resistance level at 122.6 yuan, representing a slightly out-of-the-money structure. The advantage of the Huatai call warrant (22618) lies in its highest leverage (7.7 times) and low implied volatility; the BOC call warrant (22826) stands out for having the lowest premium and implied volatility, with a leverage of 8.3 times. Both exercise prices are close to the 122.6 yuan resistance zone, making them suitable for investors expecting the stock price to break through this resistance and move higher.
If you prefer to position near the support level, consider the bull certificates with a recovery price of 95 yuan, such as the J.P. Morgan bull certificate (67330) $JP#JDCOMRC2612A.C (67330.HK)$ and the BNP Paribas bull certificate (68271) $BP#JDCOMRC2704D.C (68271.HK)$ . The advantage of the J.P. Morgan bull certificate (67330) is its high actual leverage (5.9 times) and low premium; the BNP Paribas bull certificate (68271) stands out for having the highest actual leverage (5.8 times) and the lowest premium. Both have recovery prices below the first support level of 108.6 yuan, offering substantial buffer space.

For bearish strategies, consider the BOC put warrant (26416) $BIJDCOM@EP2609A.P (26416.HK)$ and the J.P. Morgan put warrant (25892). Their exercise prices are 96.83 yuan and 96.88 yuan respectively, both below the second support level of 102.8 yuan, representing an out-of-the-money structure. The advantage of the BOC put warrant (26416) lies in its lowest premium and implied volatility, with a leverage of 4.8 times; the J.P. Morgan put warrant (25892) stands out for having relatively low implied volatility, with a leverage of 4.2 times. Both are suitable for investors expecting the stock price to pull back and test the 108.6 yuan or even 102.8 yuan support levels.
For bear contracts, investors may consider UBS Group bear contract (56284).$UB#JDCOMRP2808B.P (56284.HK)$And JPMorgan bear contract (54827), both with a recovery price of 124 yuan, slightly higher than the second resistance level at 122.6 yuan, representing an aggressive deployment close to the resistance zone. The advantage of UBS Group bear contract (56284) lies in its lowest premium and relatively higher actual leverage (7.7 times); JPMorgan bear contract (54827) stands out for having the highest actual leverage (7.5 times) and a lower premium, making it suitable for investors who expect the stock price to face resistance between 122 yuan and 124 yuan before retreating.
Do you think JD.com (09618) can break through the 117.6 yuan resistance in the short term?
A. Yes, the halt in the food delivery war benefits leading platforms.
B. No, technical overbought conditions require consolidation first.
Disclaimer: This article does not constitute any investment advice. It is for reference only and does not constitute any investment advice. Market data, opinions, and analyses contained herein may change at any time without prior notice. We are not responsible for any losses or damages caused by reliance on the information in this article. Technical analysis shows whether some technical conditions are met, but should be combined with other materials for comprehensive evaluation of asset performance. Trading decisions should not be based solely on this article. Note that past performance is not indicative of future results. Follow Jenny's HK Stock Warrants for more professional insights.
#JD #09618 #TechnicalAnalysis #SupportLevel #ResistanceLevel #Warrants #BullBearCertificates #CallOptions #PutOptions #HongKongWarrantsJenny
Risk Disclaimer: The above content only represents the author's view. It does not represent any position or investment advice of Futu. Futu makes no representation or warranty.Read more
Comments
to post a comment