

Pop Mart plans to launch new products! Can the IP giant capitalize on this opportunity?

Pop Mart's stock plunged over 30% in two days after earnings. Should investors bet on a rebound or follow the trend to short sell?
The leading Hong Kong-listed toy company $POP MART (09992.HK)$
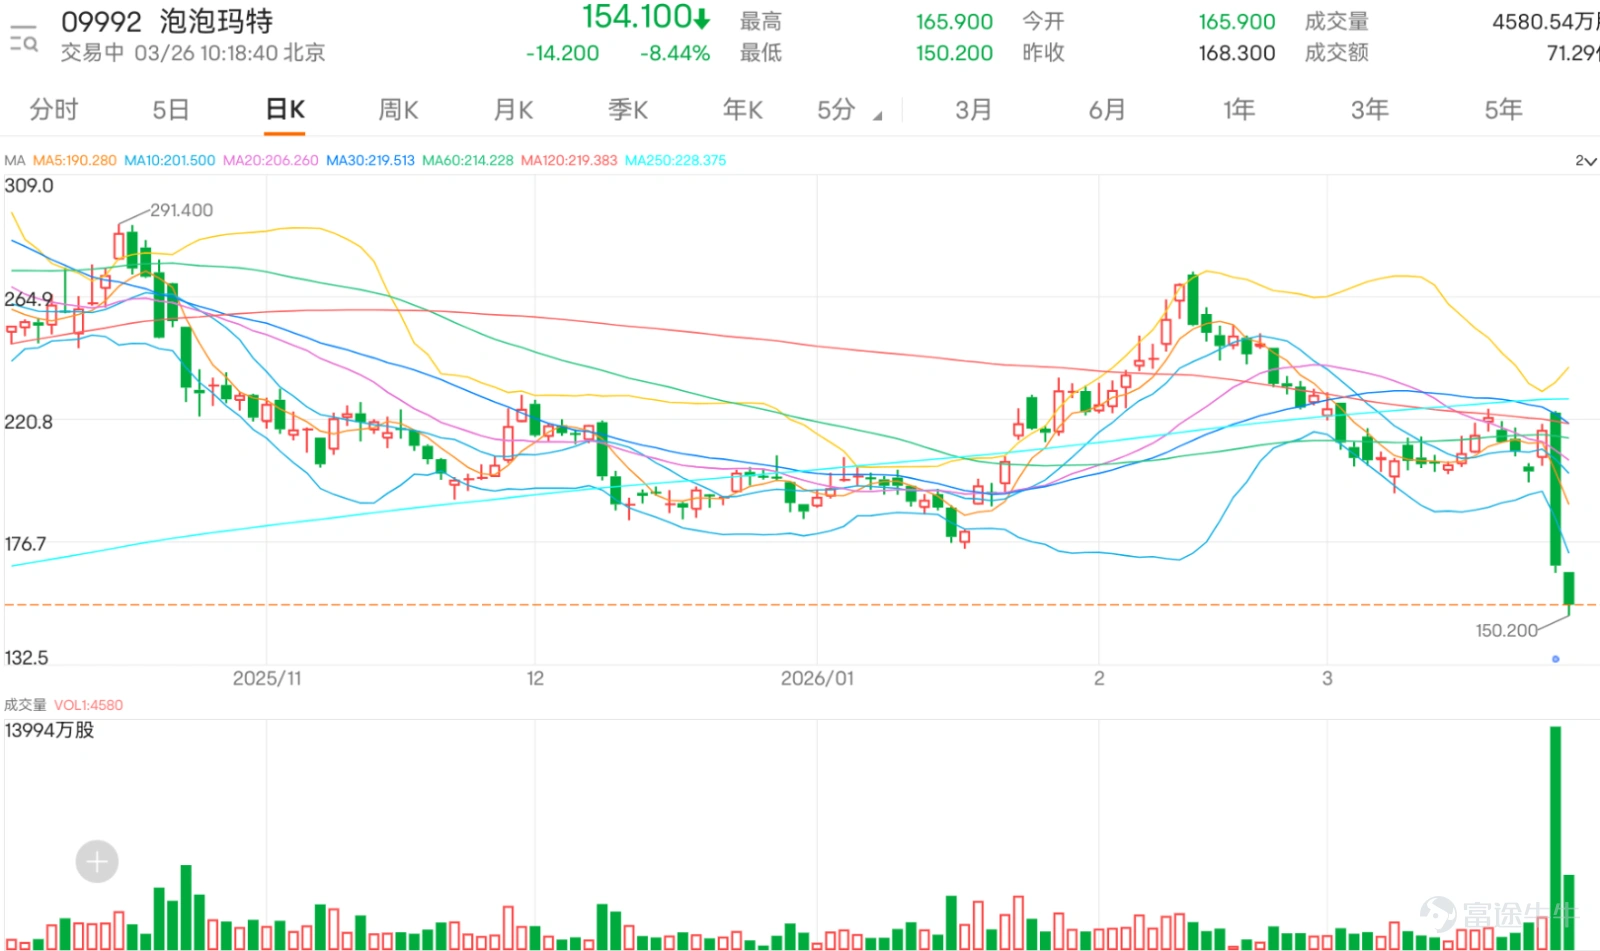
Following the earnings announcement, the stock faced heavy selling pressure. The share price plunged 22.51% on the previous day (the 25th), and continued to drop on the 26th, hitting an intraday low of HKD 150.2. Multiple investment banks adjusted their target prices and investment ratings for the company, showing a general trend of 'remaining optimistic but with widespread target price reductions'.
Specifically, Citi lowered its target price from HKD 415.00 to HKD 350.00, a decrease of 15.7%, while maintaining a 'Buy' rating. HSBC reduced its target price from HKD 354.00 to HKD 329.50, a decrease of 6.9%, also maintaining a 'Buy' rating. UBS Group cut its target price from HKD 326.00 to HKD 278.00, an adjustment of 14.7%, keeping the 'Buy' rating. Similarly, Morgan Stanley decreased its target price from HKD 325.00 to HKD 278.00, a reduction of 14.5%, and maintained an 'Overweight' rating.
Goldman Sachs made a more significant adjustment, reducing its target price from HKD 300.00 to HKD 184.00, a sharp decrease of 38.7%, with only a 'Neutral' rating assigned. Deutsche Bank was the most pessimistic, cutting its target price from HKD 228.00 to HKD 157.00, a drop of 31.1%, and downgrading its rating directly from 'Hold' to 'Sell'.
Pop Mart's current stock price has clearly fallen below all key medium-term moving averages, including MA10 (206.61), MA30 (222.95), and MA60 (215.00), showing a clear bearish pattern. The strong signal of a weakening mid-term trend indicates significant selling pressure with signs of panic-driven exits.
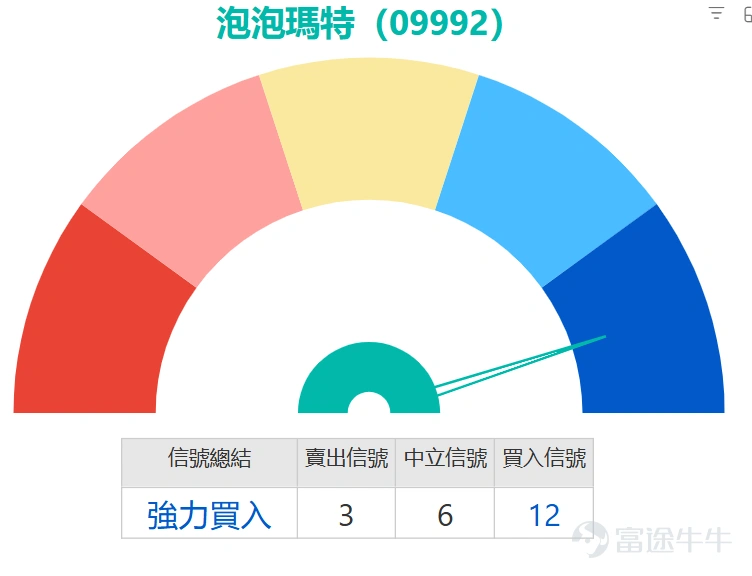
From the analysis of key technical indicators, the market is sending highly contradictory signals, forming the main focus of the current trading dynamics. On one hand, trend-following indicators have deteriorated across the board. The MACD signal is in the sell region and may further expand; the ADX indicator, combined with the sharp price drop, shows increased downward trend momentum. The Bollinger Bands show the stock price breaking below the lower band, confirming strong short-term downward momentum. However, on the other hand, a series of oscillation indicators have entered extreme zones due to the rapid short-term decline in stock price, issuing potential rebound warnings. The RSI indicator has dropped to an oversold level of 28, and the Stochastic Oscillator is also in the oversold zone. More notably, the Momentum Oscillation Indicator showed an initial 'bottom divergence' signal—while prices hit new lows, the momentum indicator did not follow, often seen as an early technical sign of weakening downside momentum. Additionally, the CCI indicator is also in extremely oversold territory.
In terms of critical price levels, the current stock price is testing the first important technical support at 154.5 yuan. If this support breaks, the next support will be at 131.7 yuan. Above, resistance is significant; recent rebounds will first face the test of resistance at 212.8 yuan, near the convergence zone of multiple moving averages, making a breakout difficult. Stronger resistance is located at 276 yuan.
Summary and Strategy Logic:
Considering all technical signals, the system issued a 'strong buy' summary signal, but with a strength value of 12, which diverges from several trend indicators’ sell signals. This precisely reflects the core contradiction in the current technical picture: the confrontation between the need for a rebound from extreme oversold conditions and the clear downward trend. For professional investors, this is not a clear one-way trend-following timing but rather a high-risk swing trading opportunity.
The bullish logic is based on 'oversold recovery.' The stock price has experienced a large short-term decline, with multiple oscillation indicators deeply oversold and showing signs of bottom divergence. Combined with a 69% probability of an upward move and a 5-day volatility of 34.7%, it indicates volatile market conditions, suggesting a higher likelihood of a technical rebound. If the stock price can stabilize effectively above the 154.5 yuan support level, short-term traders may consider small positions to bet on a rebound.
The bearish logic is grounded in 'trend power.' Prices broke through all major moving averages with heavy volume, and trend indicators turned completely bearish, meaning any rebound is likely to encounter heavy selling pressure in the newly formed moving average resistance area (206-215 range). If the 154.5 yuan support fails, the downside will open up, and trend traders should primarily avoid or go short accordingly.
After Pop Mart’s stock price plummeted the previous day, market funds significantly concentrated into bullish products within a single day while flowing out of bearish products, reflecting a shift in market sentiment. Notably, the bullish product capital inflow surged, with call warrant street volume increasing sharply from 813.45 million shares to 1,367.05 million shares, indicating a substantial rise. Bull certificates street volume also rose from 263.39 million shares to 435.88 million shares, further confirming the warming short-term bullish sentiment, with more funds capturing potential upside via leveraged products.
Bearish products continued to see capital outflows, with put warrant street volume declining from 220.00 million shares to 138.82 million shares, reflecting reduced bearish positions as some investors may have closed their positions or changed their views. Bear certificate street volume slightly decreased from 93.17 million shares to 84.67 million shares; though the change was minor, the direction aligns with put warrants, showing weakened bearish deployment.
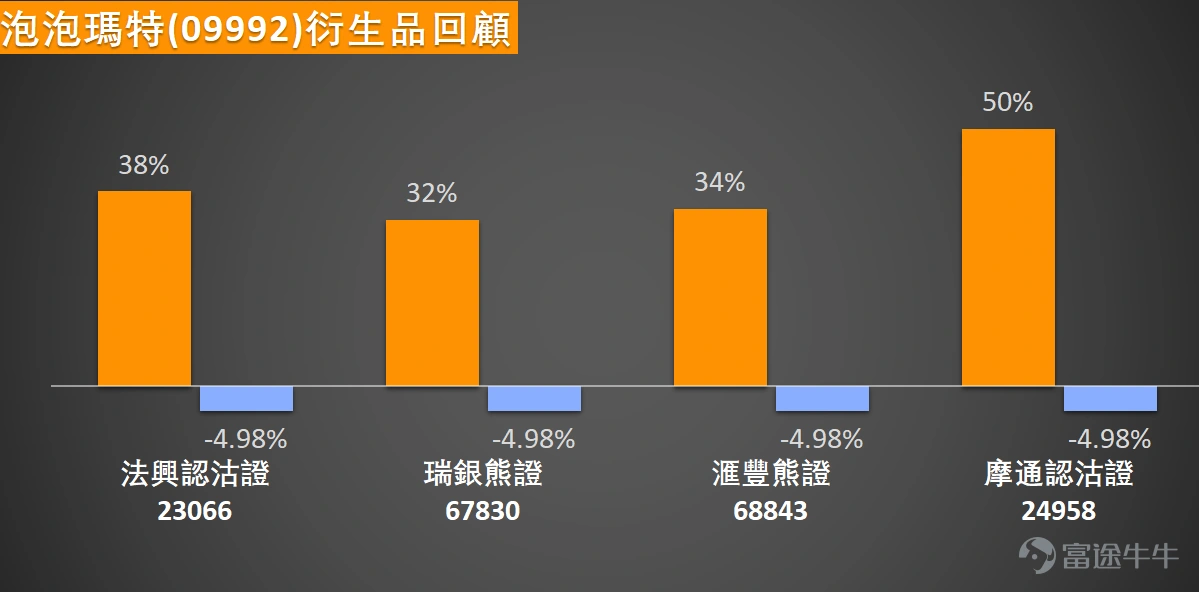
Looking back at March 19, 2026: In the following two trading days, Pop Mart's stock price fell by 4.98%, resulting in significant gains across all bearish products, where $JPPOMRT@EP2605B.P (24958.HK)$ the increase reached 50%, $SGPOMRT@EP2606A.P (23066.HK)$ rose 38%, $HS#POMRTRP2812C.P (68843.HK)$ rose 34%, $UB#POMRTRP2812K.P (67830.HK)$ rose 32%, fully reflecting the corresponding relationship between derivatives and the underlying stock’s movement.
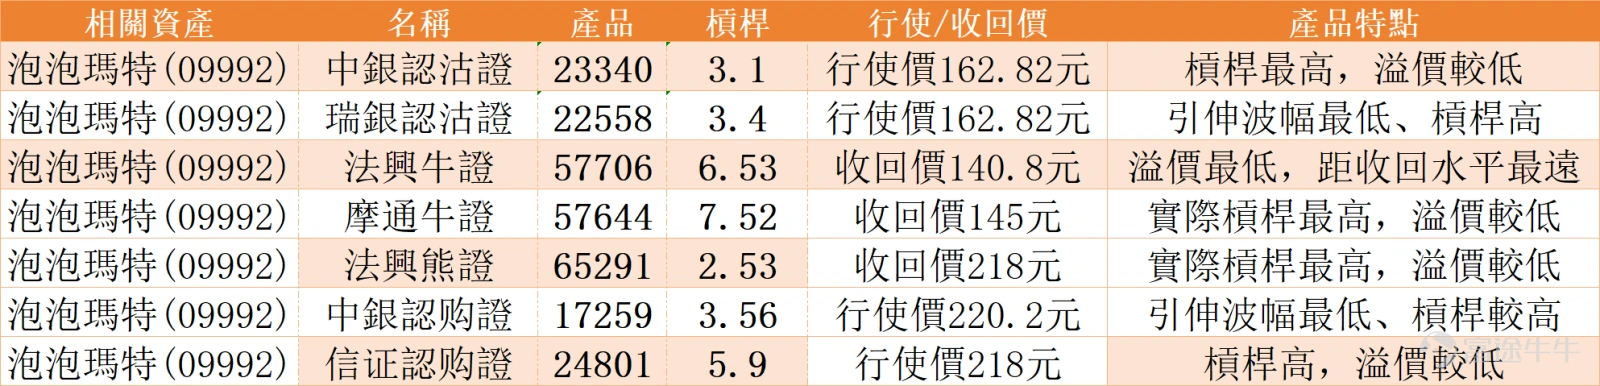
For bullish or rebound speculation options, call warrants and bull contracts can be considered. $BIPOMRT@EC2612A.C (17259.HK)$ The exercise price is 220.2 yuan, with implied volatility being the lowest among similar products, offering higher leverage suitable for those anticipating a medium-term rebound in the share price. $CIPOMRT@EC2607B.C (24801.HK)$ The exercise price is 218 yuan, providing high leverage and lower premium, ideal for investors willing to take on higher risks to capture rebound opportunities. For those opting for bull contracts, $SG#POMRTRC2608J.C (57706.HK)$ the recovery price is 140.8 yuan, with the lowest premium among existing products and a relatively distant recovery level, providing a larger buffer zone; whereas $JP#POMRTRC2610A.C (57644.HK)$ the recovery price is 145 yuan, offering the highest actual leverage with relatively low premium, suitable for short-term traders aiming for technical rebounds and seeking high leverage effects.
For bearish strategies, investors may consider put warrants and bear contracts. Among them, $BIPOMRT@EP2607A.P (23340.HK)$ the strike price is set at HK$162.82, offering higher leverage with relatively low premium, suitable for investors who are bearish on the market outlook and wish to deploy at a lower cost. Another option is $UBPOMRT@EP2607A.P (22558.HK)$ with the same strike price of HK$162.82; its implied volatility is the lowest among similar products, and its leverage is also attractive, effectively reducing the impact of time decay. For those considering bear contracts, $SG#POMRTRP28125.P (65291.HK)$ the redemption price is set at HK$218, with the highest actual leverage currently available, and it also has a relatively low premium, making it suitable for aggressive investors seeking to capitalize on short-term downward movements.
Each of the above products has its own unique features. Investors should choose appropriate tools based on their view of the market direction, risk tolerance, and investment horizon. It is essential to be aware that derivatives involve high risks, with prices subject to significant fluctuations. Investors should carefully review terms and assess risks before investing.
The current Pop Mart trading logic shows intense clashes between bulls and bears: while multiple technical indicators signal oversold conditions suggesting a potential rebound, the medium-term trend clearly points to a bearish shift. Would you choose to take small positions betting on a rebound from an oversold situation, or would you prefer to avoid downside risks by following the trend? Feel free to share your thoughts in the comments section. For more market analysis, please continue following 'HK Stock Warrants Jenny' daily updates!
Reminder: This article does not constitute any investment advice.
This article is for reference only and does not constitute any investment advice. Market data, opinions, and analyses contained herein may change at any time without prior notice. We are not responsible for any loss or damage caused by reliance on the information in this article. Technical analysis only shows whether certain technical conditions are met, and asset performance should be comprehensively evaluated in conjunction with other information. Trading decisions should not be made solely based on this article. Please note that past performance is not indicative of future results. $Hang Seng Index (800000.HK)$$Hang Seng TECH Index (800700.HK)$
#HKStocks #RealTimeAnalysis #WarrantPicks #WarrantStrategy #DerivativesHedging #HKStockWarrantsJenny #PopMart #09992 #TechnicalAnalysis
Risk Disclaimer: The above content only represents the author's view. It does not represent any position or investment advice of Futu. Futu makes no representation or warranty.Read more


Comments
to post a comment
2
3