
Earnings reports from Chinese giants raise concerns! Is it a good time to buy on dips?

Short-term strategy for Tencent: 500 HKD serves as the bullish-bearish dividing line; if it breaks down, targets are 490 HKD and 454 HKD.
As of March 25, 2026, Tencent (00700) closed at 505.5 HKD, down 1.65% for the day, with a trading volume reaching 19.008 billion HKD. Market activity was strong but selling pressure was evident.
Today (March 27), the stock price was at 502.5 HKD, slightly down by 0.59%. Hong Kong-listed tech stocks showed mixed performance today, with Alibaba (09988) $BABA-W (09988.HK)$ Tencent (0700.HK) reported at HKD 125.8, down 2.48%; Meituan (03690.HK) $MEITUAN-W (03690.HK)$ reported at HKD 88.2, down 1.94%; Xiaomi (01810.HK) $XIAOMI-W (01810.HK)$ reported at HKD 32.56, up 0.12%;
From a technical perspective, the stock price has pulled back from recent highs and is now close to the lower boundary of the trading range, indicating weak short-term momentum. The short-term moving averages MA10 and MA30 are at HKD 529.19 and HKD 528.56 respectively, acting as clear resistance levels, while MA60 sits at HKD 566.92, further confirming that the mid-term trend has yet to strengthen. Based on multiple technical indicators, the system has issued a "buy" signal with a strength of 9. Oscillators such as the CCI and ROC both indicate "severely oversold, possible bottoming, buy," suggesting there may be a technical rebound after the sharp short-term decline. However, MACD signals and Bollinger Bands suggest "sell," with the RSI at 38, reflecting weak market momentum.According to technical analysis data, key short-term support levels are at HKD 490 and HKD 454, while resistance levels are at HKD 540 and HKD 566. The probability of an upward move is 54%, with a 5-day volatility of 6.8%, indicating relatively moderate price fluctuations.
In terms of market news, Tencent has continued to make headlines in business development and capital operations as of March 26. According to mainland media reports, its gaming business is performing well in overseas markets, with several new game launches receiving positive feedback. Additionally, Tencent has been repurchasing shares for several consecutive days, signaling management's confidence in the company’s prospects. Naspers’ plan to reduce its stake is nearing completion, gradually easing potential downward pressure on the stock price.
According to the March 25 [Hong Kong Stock Podcast], Tencent is currently trading at HKD 505.5, near the lower end of its recent trading range, reflecting weak momentum. Immediate support lies at the psychological level of HKD 500, followed by the recent low of HKD 495.20. Resistance is seen between HKD 512 and HKD 513, and then in the region of HKD 524 to HKD 529. The podcast analysis suggests that if the stock falls below HKD 500, it would signal a breach of the psychological threshold; failing to hold above HKD 495.20 would exacerbate the short-term weakness. For a meaningful rebound to occur, the stock must first defend the support zone around HKD 500 and HKD 495.20, regain the HKD 512 to HKD 513 resistance, and eventually reclaim the moving average resistance between HKD 524 and HKD 529. Currently trading at HKD 505.5, the stock is testing key support levels at this critical moment.
In terms of warrant funds, there are a total of 348 related products in the market, including 283 call warrants and 65 put warrants, showing a clear bias towards call warrants in terms of product numbers. The most concentrated trading area for call warrants is in the exercise price range of $620 to $629.99, while for put warrants, it is concentrated between $480 and $489.99. In terms of street-level holdings distribution, the largest concentration for call warrants is also in the $620 to $629.99 range, while for put warrants, it remains in the $480 to $489.99 range, indicating an overall one-sided concentration. This reflects that the market structure still shows more capital positioning for a rebound, but put warrants in the $480 to $489.99 range have a clear focus, suggesting that short-term downside risks are not entirely ignored by the market. In other words, although the overall product structure leans toward a bullish outlook, short-term sentiment isn't completely unified because the underlying stock itself remains weak.
Regarding investor concerns about whether the current trend is strong or weak, this judgment is reasonable because the current price is near the lower boundary of the trading range, with declining moving averages and a weak RSI, showing no signs of strengthening. As for whether the HKD 500 bull contract will be called, the answer is that there is risk, and it is not insignificant. With the current price at HKD 505.5, it is very close to HKD 500. Any additional downward pressure could easily trigger a forced call for these near-strike bull contracts, so HKD 500 should not be considered a safe distance. On the other hand, some investors have reasonably deployed bull contracts with a call price of HKD 425, which offers a larger buffer from the current price and reduces the likelihood of being triggered by normal intraday volatility, making it suitable for betting on a short-term technical rebound. However, being reasonable does not equate to high reward potential, as the underlying stock has yet to show definitive signs of strengthening. Even when choosing bull contracts with farther call prices, the reward-to-risk ratio remains neutral to cautious, and is not particularly attractive.
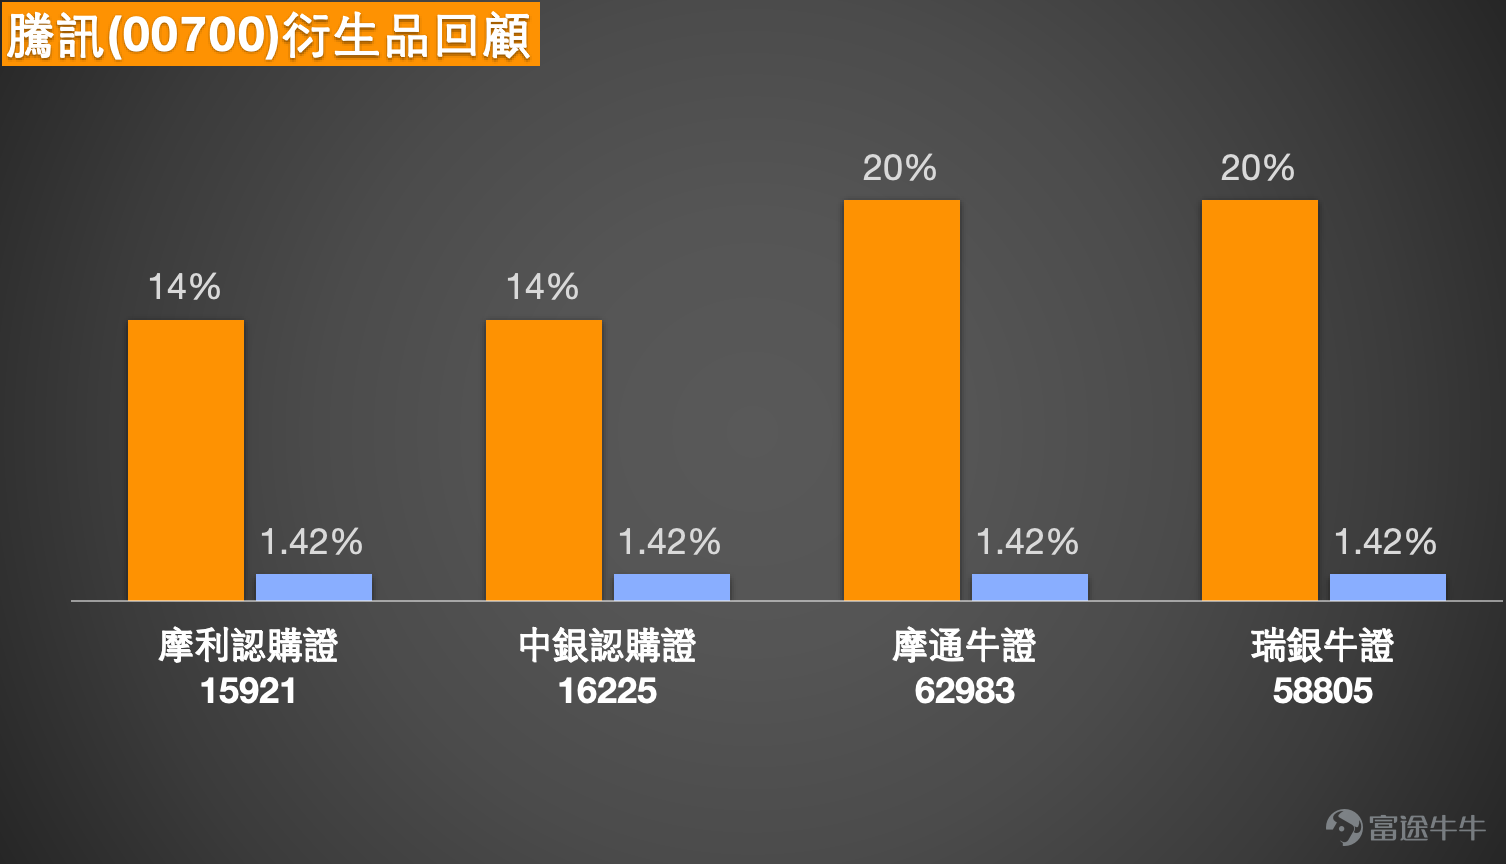
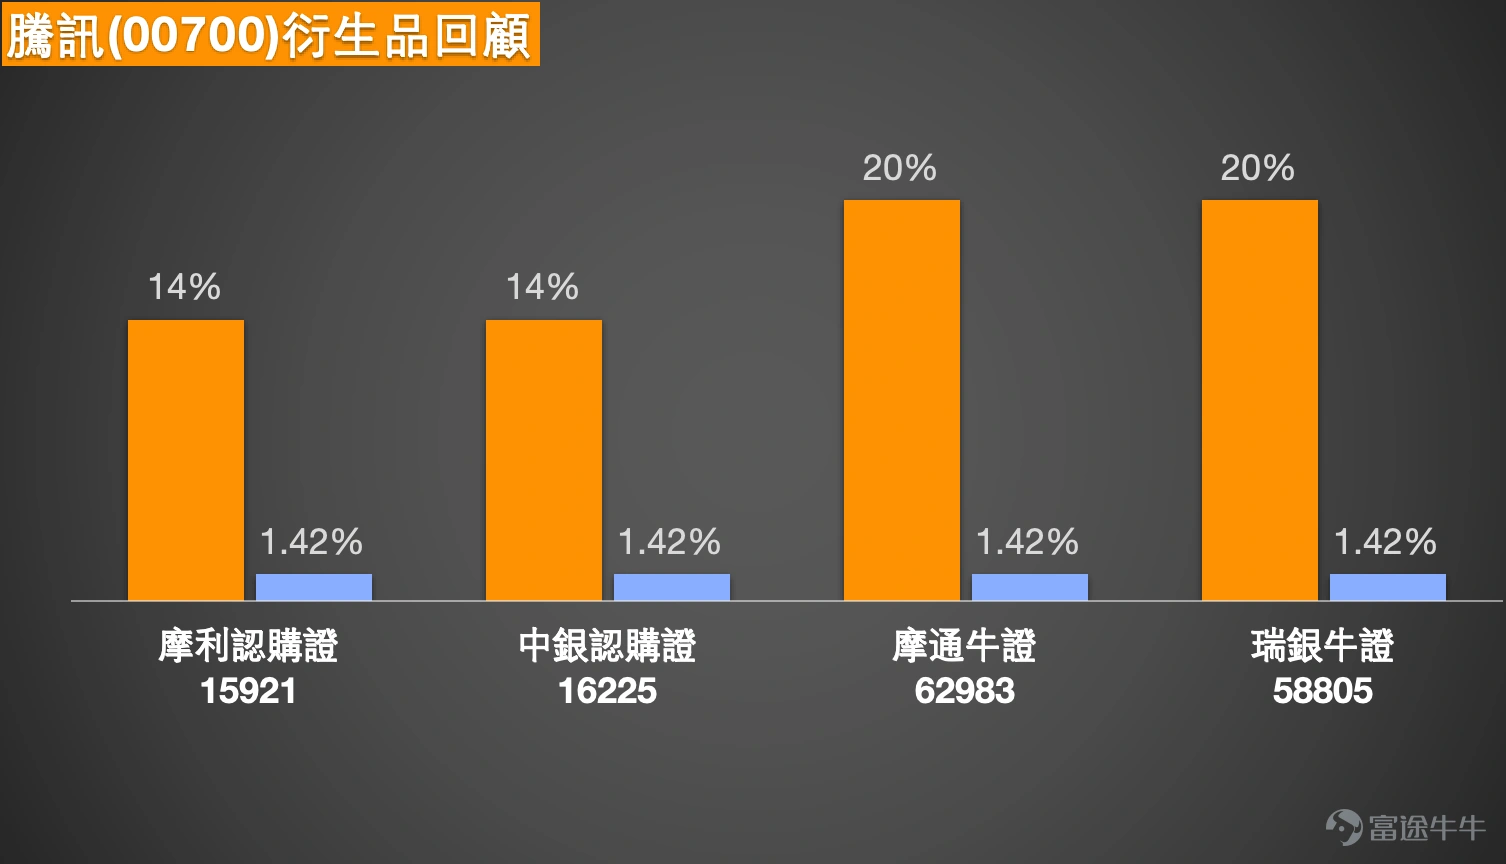
Reviewing the warrant market performance, based on the product review from March 23, the four products mentioned recorded significant gains over the following two days (up to March 25), successfully capturing the underlying stock’s rebound. Among them, J.P. Morgan bull certificate (62983) $JP#TENCTRC2609R.C (62983.HK)$ and UBS Group bull certificate (58805) $UB#TENCTRC2607V.C (58805.HK)$ Both recorded a 20% increase, performing exceptionally well; the Moly认购证 (15921) and Bank of China认购证 (16225) both rose by 14%. During the same period, the underlying stock increased by 1.42%, and the related bull certificates and call warrants fully leveraged their effects, showing that appropriate derivatives can effectively amplify returns in a rebound trend.
Based on technical analysis, market environment, and Podcast insights, Tencent is currently at a critical juncture where it tests support in the short term. Investors should use 500 yuan as the short-term bullish-bearish dividing line. If it fails to hold, it may drop to 490 yuan and then 454 yuan. If it holds firm and rises back above 512 to 513 yuan, it could trigger a technical rebound and challenge resistance at 540 yuan. The following are analyses of some relatively clear terms for CBBCs and warrants whose strike prices and stop-loss levels are closely related to technical support and resistance:
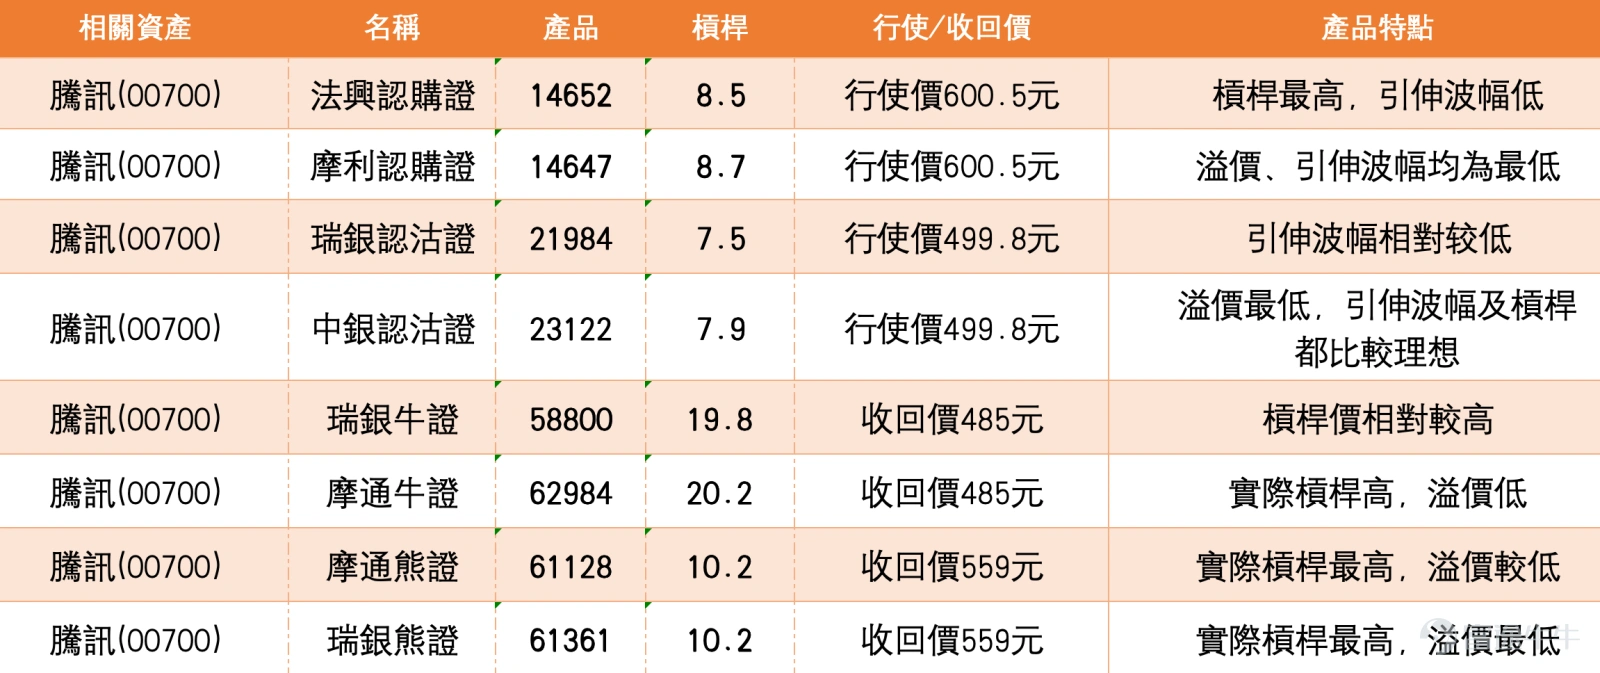
For bullish deployment, consider Societe Generale call warrant (14652) $SGTENCT@EC2609A.C (14652.HK)$ and Moly call warrant (14647) $MSTENCT@EC2609A.C (14647.HK)$ Both have an exercise price of 600.5 yuan, higher than the second resistance level at 566 yuan, making them out-of-the-money structures. The advantage of Societe Generale call warrant (14652) lies in having the highest leverage (8.5x) and lower implied volatility; Moly call warrant (14647) stands out with the lowest premium and implied volatility, offering leverage of 8.7x. Both are suitable for investors expecting the stock price to break through the 566 yuan resistance and move higher. For those looking to deploy near support for a rebound, consider bull certificates with a stop-loss price of 485 yuan, such as UBS bull certificate (58800) and JPMorgan bull certificate (62984). UBS bull certificate (58800) has the advantage of relatively high-leverage pricing (19.8x); JPMorgan bull certificate (62984) offers high actual leverage (20.2x) and low premium. Both have stop-loss prices below the first support level of 490 yuan, providing a certain buffer. According to the Podcast view, if investors want to bet on a rebound, choosing a bull certificate with a farther stop-loss price (e.g., 425 yuan) is relatively safer, but products with a 485 yuan stop-loss still carry risks, so attention must be paid to whether the stock price can hold above the 500 yuan mark.
For bearish deployment, consider UBS put warrant (21984) $UBTENCT@EP2606A.P (21984.HK)$ and Bank of China put warrant (23122) $BITENCT@EP2606A.P (23122.HK)$ Both have an exercise price of 499.8 yuan, close to the psychological level of 500 yuan, making them slightly out-of-the-money structures. UBS put warrant (21984) stands out with relatively lower implied volatility and leverage of 7.5x; Bank of China put warrant (23122) has the lowest premium, along with ideal implied volatility and leverage of 7.9x. Both are suitable for investors expecting the stock price to fall below 500 yuan and test support at 490 yuan or even 454 yuan. For bear certificates, consider JPMorgan bear certificate (61128) and UBS bear certificate (61361), with stop-loss prices of 559 yuan, higher than the first resistance level of 540 yuan, providing a larger safety margin. JPMorgan bear certificate (61128) offers the highest actual leverage (10.2x) and lower premium; UBS bear certificate (61361) stands out with the highest actual leverage (10.2x) and lowest premium, making it suitable for bearish deployments.
Overall, Tencent is at a crucial moment of testing support amid short-term weakness. Investors should use 500 yuan as the short-term bullish-bearish dividing line. A failure to hold would require attention to support levels at 490 yuan and 454 yuan; if it holds firm and rebounds, breaking through resistance between 512 and 513 yuan will confirm strength. When selecting derivative products, one should balance leverage against the distance of stop-loss/exercise prices based on their judgment of future market direction and intensity, while keeping in mind the Podcast's point that 'bull certificates around 500 yuan carry significant risk.'
Interactive Questions
Do you think Tencent (00700) can hold the 500 yuan mark in the short term?
A. Yes, the oversold rebound is expected to hold steady
B. No, the downtrend remains and will further test the support at HKD 490
Disclaimer: This article does not constitute any investment advice. It is for reference only and does not constitute any investment advice. Market data, opinions, and analyses contained herein may change at any time without prior notice. We are not responsible for any losses or damages caused by reliance on the information in this article. Technical analysis shows whether some technical conditions are met, but should be combined with other materials for comprehensive evaluation of asset performance. Trading decisions should not be based solely on this article. Note that past performance is not indicative of future results. Follow Jenny's HK Stock Warrants for more professional insights.
#Tencent #00700 #TechnicalAnalysis #SupportLevel #ResistanceLevel #Warrants #BullBearCertificates #CallWarrants #PutWarrants #HKStocksJenny
Risk Disclaimer: The above content only represents the author's view. It does not represent any position or investment advice of Futu. Futu makes no representation or warranty.Read more

Comment (1)
to post a comment
4