

Meituan's earnings report is finally out! Are tech stocks still worth buying?

March 25th [HK Stocks Podcast] Part 1 - Hang Seng Index, Meituan, Nongfu Spring,
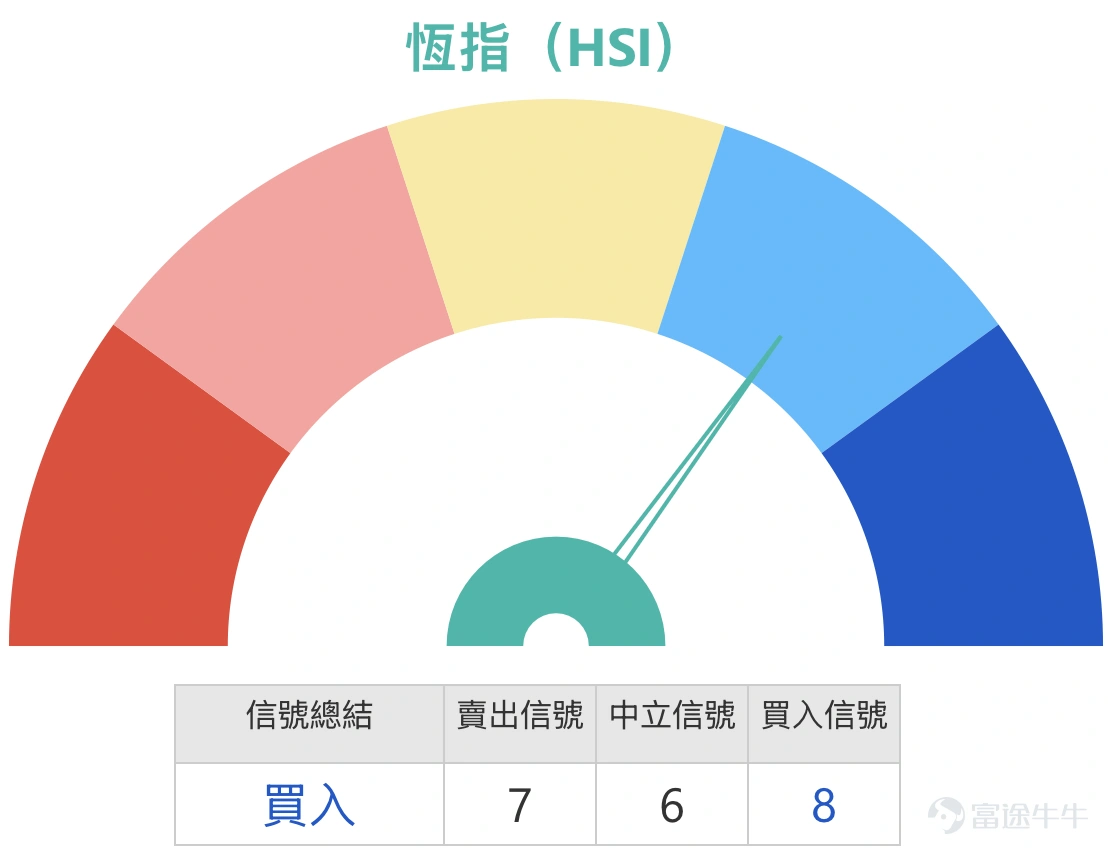
1. Hang Seng Index: Investors who are optimistic expect the upward trend to reach 25,501 points, targeting bearish warrants, and choose bull warrants with a stop-loss at 24,008 points to hold overnight; some investors believe that major players have already built up bearish positions over two days, predicting declines on Thursday and Friday, opting for bearish warrants with a stop-loss at 26,100 points.
The current price of the Hang Seng Index is 25,335.95 points, still fluctuating within the large range of 24,203.54 points to 27,397.65 points in the short term, with overall volatility of approximately 13.2%. Based on the current position, the nearest support below is around 24,845 points, close to the recent recovery zone after the pullback, followed by the 24,680-point to 24,200-point region; the resistance above is first seen at 25,450 points to 25,650 points, as this area is near multiple short- and medium-term moving averages and the middle Bollinger Band line. Further up, significant resistance is noted near 26,300 points. The current price is in the lower-middle part of the entire range, indicating that although there may be a short-term rebound, it hasn't truly strengthened yet.
In terms of technical indicators, the overall moving averages are still trending downward, with the 5-day, 10-day, 20-day, 30-day, and 60-day moving averages all above the current price, indicating that the broader trend has not yet escaped its weaker structure. The Relative Strength Index (RSI) is at a level close to neutral but leaning towards weakness, reflecting market attempts to rebound, though without strong momentum, and no clear bullish signal has emerged so far. The Bollinger Bands are currently in a narrowing and consolidating state, with the index positioned near the lower half of the band, not extremely oversold, but still showing that upward pressure remains.
If the index is to move upward in the short term, the triggering condition is clear: the index must not break below the nearby support at 24,845 points again and must stabilize above the resistance zone of 25,450 to 25,650 points. Only when the index firmly holds above this area will it have the conditions to further test 25,501 points, and potentially push toward levels above 25,800 points. In other words, reaching 25,501 points is not impossible, but the immediate resistance zone must first be broken through and stabilized, otherwise, it's just a rebound within the range and doesn't represent the start of a new uptrend.
On the contrary, the downside risk is also very clear. If the index falls below 24,845 points again, it indicates a failure of the short-term rebound, and the market will retest the support zone between 24,680 and 24,200 points. If even the area near 24,200 points is breached, the overall weakness will intensify again, and at that point, it won't just be a simple pullback in the short term, but could potentially lead to further declines. In other words, the key direction over the next two days isn't about being bullish or bearish subjectively, but rather whether 24,845 points can hold and whether there will be a breakout above 25,450 to 25,650 points.
In terms of capital structure, the most concentrated trading for bull contracts is in the forced call price range of 24,800 to 24,999 points, while for bear contracts, it's most concentrated between 25,600 and 25,799 points, reflecting that the market is mainly deploying around both sides of the current price in the short term, which is a typical seesaw pattern caught in the middle. In terms of open interest, bull contracts are most concentrated between 24,000 and 24,199 points, and bear contracts are most concentrated between 25,400 and 25,699 points, indicating a certain accumulation of long-dated bulls below and a noticeable clustering of near-price bear contracts above. Overall, the market hasn’t shown a very unified one-sided direction since both trading and open interest are concentrated on both sides, representing that funds are still in a state of speculation—not purely bullish or purely bearish.
From the perspective of investors, the bullish side believes that the market needs to rise above 25,501 points to force out bear contracts and choose overnight bull contracts with a forced call price at 24,008 points. This view has some merit because the 24,008-point forced call price is at a certain distance from the current price, making the risk of being called out by intraday fluctuations relatively low in the short term. Additionally, the most concentrated area of bull contract open interest itself is around 24,000 points, showing that such distant forced call price strategies are indeed one of the mainstream practices in the market. However, simply expecting to break through 25,501 points due to a forecast of forcing out bears is still somewhat premature, as the most critical factor now is breaking through the resistance zone between 25,450 and 25,650 points. Therefore, this bullish view is understandable but not very stable.
On the other side, some believe that major players have already built up bearish positions, and Thursday and Friday will see a decline, choosing bear contracts with a forced call price at 26,100 points. This view is not entirely baseless either, as the range between 25,600 and 25,799 points is where bear contract trading is most concentrated, and between 25,400 and 25,699 points is also where bear contract open interest is concentrated, indicating that the market does have participants who are bearishly positioned above. However, the bear contract at 26,100 points isn't too far from the current price, so if the index breaks through the resistance zone upwards, the risk of these near-price bear contracts will significantly increase. Thus, this strategy is more of a bet on a short-term pullback after hitting resistance, rather than a high-certainty directional bet.
Overall, both viewpoints have their logic, but neither is overwhelmingly convincing. At this stage, the short-term reward-to-risk ratio is neutral to cautious, and it’s not a time when one side is particularly attractive. For bullish investors, if they don’t see the index stabilizing above 25,450 to 25,650 points, the reward-to-risk ratio is only average; for bearish investors, if they chase bear contracts before seeing the index fall below 24,845 points, the reward-to-risk ratio is similarly not high. A clearer approach would be to wait for a breakout above resistance to confirm an upward move or a breakdown below support to confirm a downward move. Otherwise, the situation remains within a range-bound tug-of-war. $BI-HSI @EP2606B.P (24183.HK)$$UB-HSI @EP2606B.P (24041.HK)$$BI#HSI RP2804E.P (67581.HK)$$BI#HSI RP28042.P (57310.HK)$

2. Meituan-W (03690.HK): What is the expected volatility range ahead of earnings? Some investors are buying puts, waiting for a drop on Thursday. Others are choosing bull contracts with a forced call price of HK$63 to hold overnight.
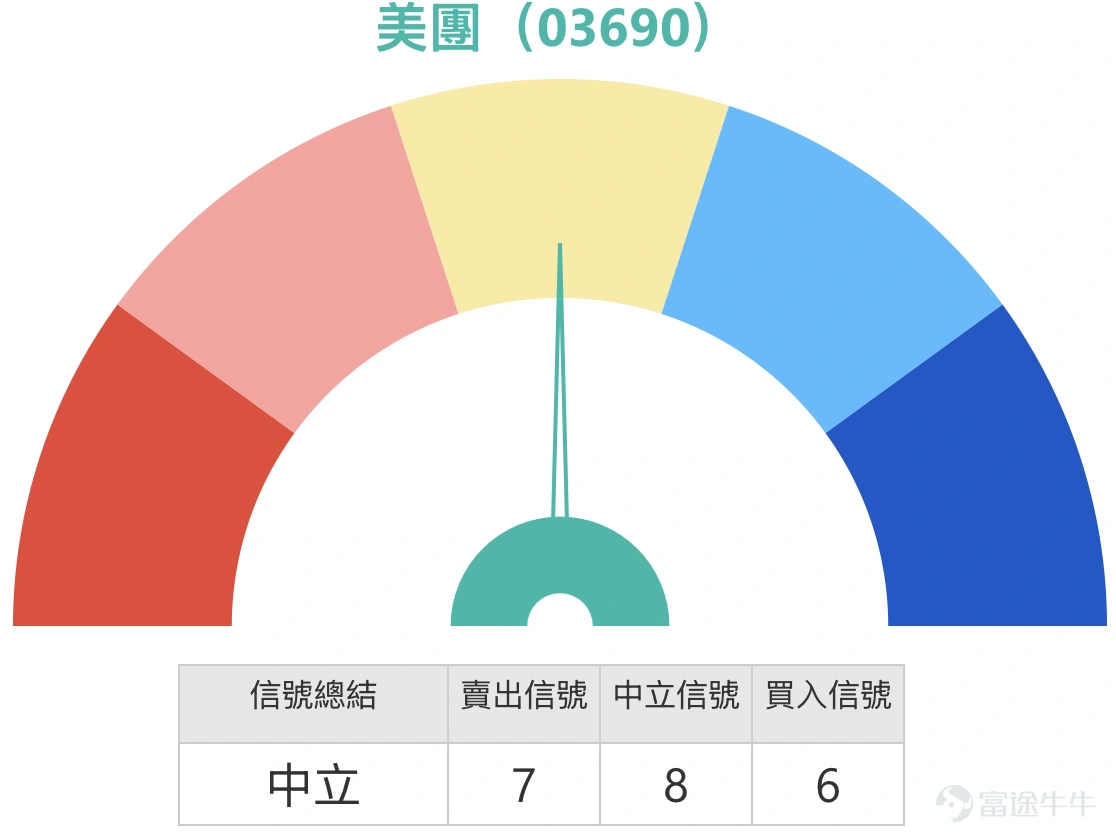
Meituan-W is currently trading at HK$90, forming a clear rebound range between HK$73.60 and HK$91.70 in the short term, with overall volatility of about 24.6%. For short-term positioning just before and after tomorrow's earnings, the nearest support levels are around HK$85 to HK$86, close to the recent pullback area after the breakout. Below that is around HK$80, and if that level fails, attention should be paid to the HK$78.66 to HK$78 region. On the upside, the first resistance is the recent high at HK$91.70. If it breaks through, the next level to watch is around HK$95, as this position is near the intermediate-term moving average pressure. The current price is in the upper half of the recent range, indicating that the short-term play is no longer a low-position bounce but rather entering a phase of heightened volatility at higher levels.
Technically, short-term moving averages are starting to strengthen and converge, showing an improvement process from previous entanglement, but the medium- to long-term moving averages remain at higher levels, indicating that the current phase is still about challenging upper resistance after a sharp rebound, rather than transitioning into a major uptrend. The Relative Strength Index (RSI) is notably strong and at a high level, reflecting strong buying power but also suggesting some overheating in the short term. The Bollinger Bands are beginning to widen, with the price running close to the upper band, typically signaling increased volatility. Especially around earnings, there may be quick retracements after large bullish candles or situations where prices gap up but close lower.
For the stock to continue moving higher, the trigger conditions are clear: it needs to effectively break through HK$91.70 and maintain a close above HK$90. Only then can the market push the short-term uptrend higher, further challenging the HK$93 to HK$95 range. If it merely spikes during the session but closes back below HK$90, it is more likely a temporary surge driven by pre-earnings sentiment and doesn’t necessarily indicate a sustained uptrend. Looking at tomorrow’s volatility range, a reasonable short-term fluctuation range would initially be between HK$85 and HK$92. If pre-earnings sentiment heats up further, it could expand to between HK$80 and HK$95, but that would represent a larger volatility scenario and shouldn’t be considered the baseline expectation.
Downside risks are equally evident. If the stock price falls below the support zone of HK$85 to HK$86, it suggests that buying power is starting to weaken after the sharp rise, and short-term pullbacks could extend to around HK$80. If even HK$80 is breached, it signals a significant cooling off of this pre-earnings speculative rally, and there may be a retest of HK$78 or even lower levels. In other words, tomorrow’s risk isn’t just about whether the price rises or falls, but because the current price is already near recent highs, any failure to break through could trigger rapid profit-taking.
In terms of capital distribution, trading in the warrant market is clearly concentrated in call warrants. There are 162 call warrants compared to only 55 put warrants, showing a bias towards bullish sentiment. The most traded call warrants have strike prices between 90 and 99.99 yuan, indicating that funds are mainly deployed around current prices and slightly out-of-the-money levels, reflecting that the market generally expects room for upward movement before and after earnings. Put warrant trading, however, is concentrated in the 70 to 79.99 yuan range, which leans more towards defensive plays or profit-taking. In terms of street inventory, call warrants are most concentrated in the 130 to 139.99 yuan range, while put warrants focus on the 100 to 109.99 yuan range. Overall, it remains one-sided, as both product numbers and trading activity significantly favor call warrants, suggesting that mainstream funds previously leaned bullish. However, the higher the market consensus, the more cautious one should be about potential reversals around earnings.
As for investors’ questions, following a sharp rise before earnings, I would first look at a fluctuation range of 85 to 92 yuan tomorrow. If sentiment rises further, there could be a chance for an expanded range of 80 to 95 yuan. The view of betting on a pullback by Thursday is not entirely unreasonable since the stock price is already near recent highs, with RSI showing strength, and volatility plus upper Bollinger Bands often lead to consolidation and pullbacks. Thus, there is indeed some short-term downward pressure. However, this strategy is only reasonable if the stock fails to break above 91.70 yuan or holds above 90 yuan after breaking through. If there’s a direct surge tomorrow, the risk of betting against it will be very high. Regarding holding bull certificates overnight with a stop-loss at 63 yuan, from the perspective of stop-loss distance, this approach is relatively conservative and unlikely to be triggered by normal intraday fluctuations. However, given the already elevated price, if there’s significant volatility or a rapid pullback post-earnings, such positions, though not immediately stopped, may still offer limited upside.
Overall, there is still some short-term value, but it's no longer at the most comfortable entry point. The bearish side has technical reasons to expect a pullback, but a clearer signal would require the stock to break below 85 to 86 yuan. For the bullish side, continuing to hold bull certificates with distant stop-loss levels can be understood, but the value of entering new positions has clearly diminished. This means both perspectives have logic, but after a sharp rise, the more reasonable approach is to wait for triggering conditions rather than blindly betting on one direction based solely on pre-earnings sentiment. $UB#MTUANRC2701A.C (60462.HK)$$BIMTUAN@EC2609A.C (26182.HK)$$JP#MTUANRC2609G.C (63797.HK)$$CTMTUAN@EC2608B.C (26323.HK)$

3. Nongfu Spring (09633.HK): Is there a chance to break through 50-55 yuan? Investors are holding call warrants with a strike price of 55.99 yuan.
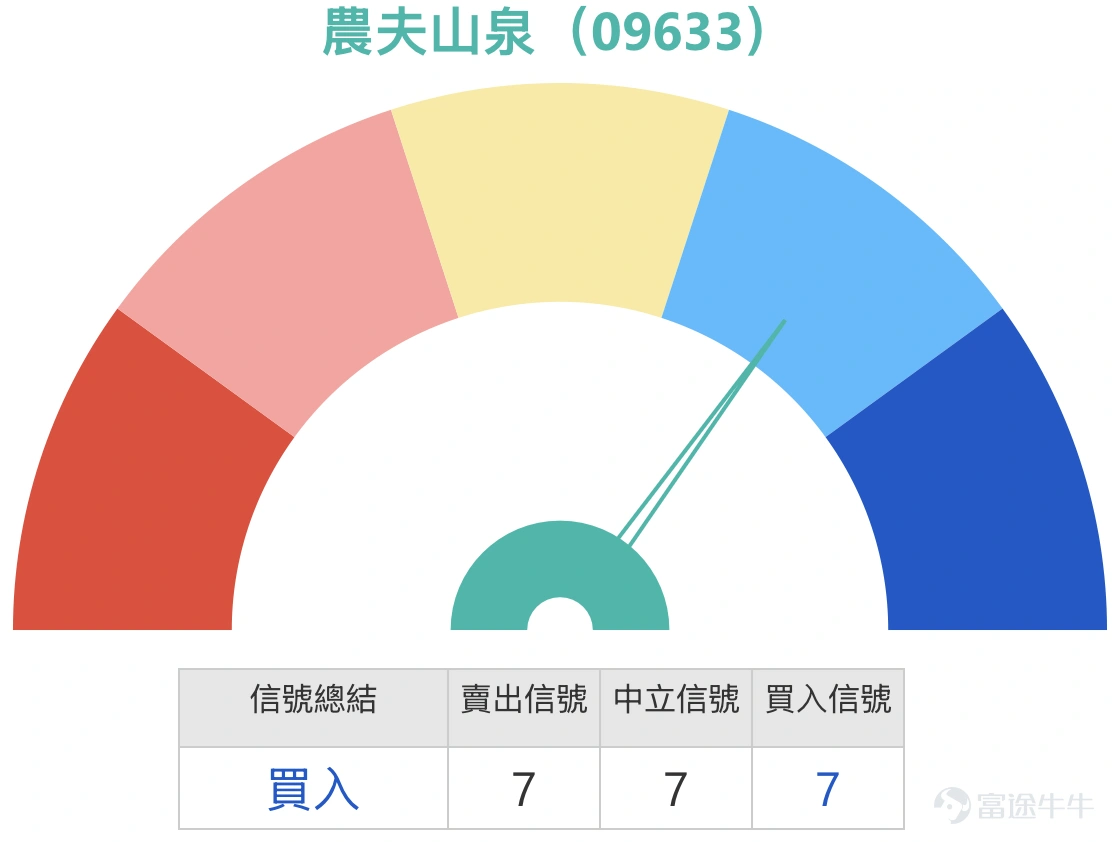
Nongfu Spring is currently trading at 46.42 yuan, with its recent clear range being between 40.70 and 50.20 yuan, representing an overall fluctuation of about 23.3%. From a short-term perspective, after rebounding from the low of 40.70 yuan, the share price has once again approached the upper half of this range. Immediate support lies around 45 to 44.40 yuan, close to short-term moving averages and the middle Bollinger Band line. Below that, the key support zone is 42.60 to 40.70 yuan, a crucial area for buying interest recently. On the resistance side, the first level to watch is around 47.20 to 47.60 yuan, as the current price is nearing this short-term pressure point. Above that, 50.20 yuan stands as a notable recent high.
Technically, the moving averages remain biased downward, indicating that the mid-term structure has not fully reversed, though a sharp rebound recovery is evident in the short term. The Relative Strength Index (RSI) has turned stronger, showing a clear rebound in short-term buying momentum. The Bollinger Bands are narrowing and approaching the upper band, reflecting that the stock is rebounding from a weak zone toward the upper pressure area. Volatility has not yet fully expanded, but the short-term directional sense is clearer than before.
For further upward movement, the trigger conditions are quite clear: the stock must first effectively break through the resistance zone of 47.20 to 47.60 yuan and then stabilize above it, providing the market with the basis to challenge 50.20 yuan. Only by breaking through and stabilizing above 50.20 yuan can a larger upward space truly open up, potentially allowing the stock to move towards levels above 50 yuan, even gradually advancing towards 55 yuan. In other words, while 50 yuan is possible, 55 yuan remains a second-phase target contingent upon breaking through and consolidating above the recent high of 50.20 yuan.
Downside risks cannot be ignored either. If the stock fails to break above 47 yuan in resistance and falls back below the 45 to 44.40 yuan support zone, it indicates weakening rebound momentum, and the stock might retest levels around 42.60 yuan. If 42.60 yuan also breaks down, the market could trend back towards the recent low of 40.70 yuan, shifting the overall pattern back into weakness. This means that the current position isn’t particularly low, and if the breakout fails, the pullback space could be significant.
Regarding warrant capital structure, the market currently offers only 9 related call warrants and no put warrants, making it a highly one-sided product structure. The most traded region is within the strike price range of 56 to 59.99 yuan, and the same range sees the highest concentration of street inventory, indicating a very focused market attention and consistent direction—essentially all deployments center around slightly out-of-the-money call warrants. This reflects that investors are largely betting on a continuation of the rebound, but due to the strong directional consensus, any failure of the underlying stock to continue rising would quickly lead to time decay and pullback pressures on these products.
Returning to the investor’s question about whether Nongfu Spring can break through 50 to 55 yuan, I would say directly that 50 yuan is possible, but 55 yuan cannot yet be considered a high-probability short-term target. The reason is simple: although the stock price has strengthened, it has not yet officially broken through the resistance above 47 yuan, let alone surpassed the recent high of 50.20 yuan. Until these two steps are completed, targeting 55 yuan remains somewhat aggressive. As for holding call warrants with a strike price of 55.99 yuan, this view is not entirely unreasonable since both market trading and street inventory are concentrated around this range, indicating that it’s not just individual investors taking big bets but that the market itself has similar positioning. However, this strike price is still relatively out-of-the-money relative to the current price, offering less short-term value unless the underlying stock continues to rise rapidly and consistently; otherwise, time decay will become noticeable.
Overall, the most reasonable short-term view at present is to first observe whether the stock price can break through HK$47.20 to HK$47.60, then further challenge HK$50.20. If it does not break HK$50.20, directly targeting HK$55 would be a slightly forward-looking expectation. It is understandable for investors to hold call warrants at HK$55.99, but the short-term risk-reward ratio is only moderately aggressive and not particularly attractive. The real condition for improving the risk-reward ratio is if the stock price effectively breaks through HK$50.20 first; otherwise, this position should be better viewed as betting on a continued rebound rather than being in a high-confidence upward trend.
Reminder: This article does not constitute any investment advice.
This article is for reference only and does not constitute any investment advice. The market data, opinions, and analysis contained herein may change at any time without prior notice. We are not responsible for any loss or damage caused by reliance on the information in this article. Technical analysis only shows whether certain technical conditions are met; a comprehensive assessment of asset performance should combine other data and should not solely rely on this article to make trading decisions. Please note that past performance is not indicative of future results. Follow Jenny's insights on Hong Kong stock warrants for more professional analysis.
Risk Disclaimer: The above content only represents the author's view. It does not represent any position or investment advice of Futu. Futu makes no representation or warranty.Read more

Comments
to post a comment
1
12