
The US-Iran peace talks present conflicting narratives! What’s next for oil prices?

[Harvest Macro] | Global Financial Markets Weekly Report 20260325
Market performance over the past week
Global capital flows
According to EPFR data, during the week of March 11 – March 18, global equity markets witnessed net inflows for the seventh consecutive week, while bond markets saw net inflows for the 47th consecutive week (with last week's net inflow at $10.21 billion). Specifically, A-shares experienced net outflows for the second consecutive week (last week's net outflow was $1.28 billion); Hong Kong stocks turned to net inflows last week (last week's net inflow was $246 million); emerging markets switched to net outflows (last week's net outflow was $2.7 billion); US equities recorded net inflows for the second consecutive week (last week's net inflow was $49.84 billion); developed European stock markets enjoyed net inflows for the 32nd consecutive week (last week's net inflow was $7.97 billion); Japanese stock markets saw net inflows for the 14th consecutive week (last week's net inflow was $3.69 billion).

Data source: EPFR and Harvest
Stock market
Review and Outlook of the Past Week
United States:
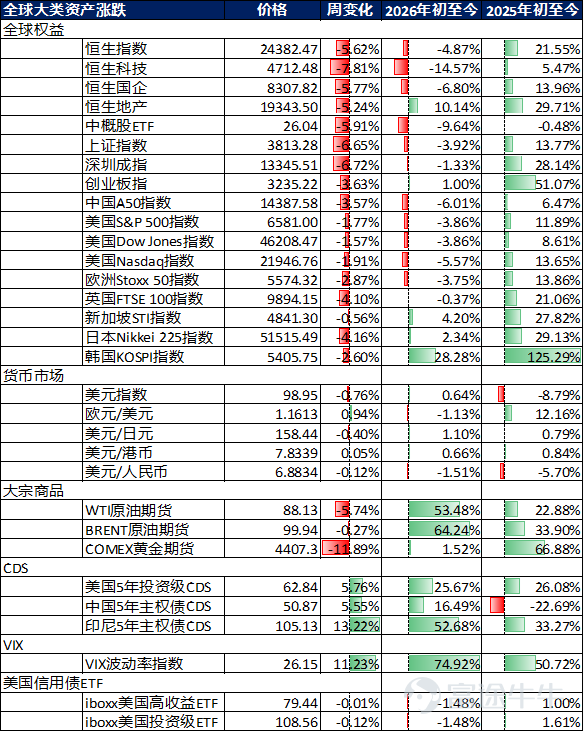
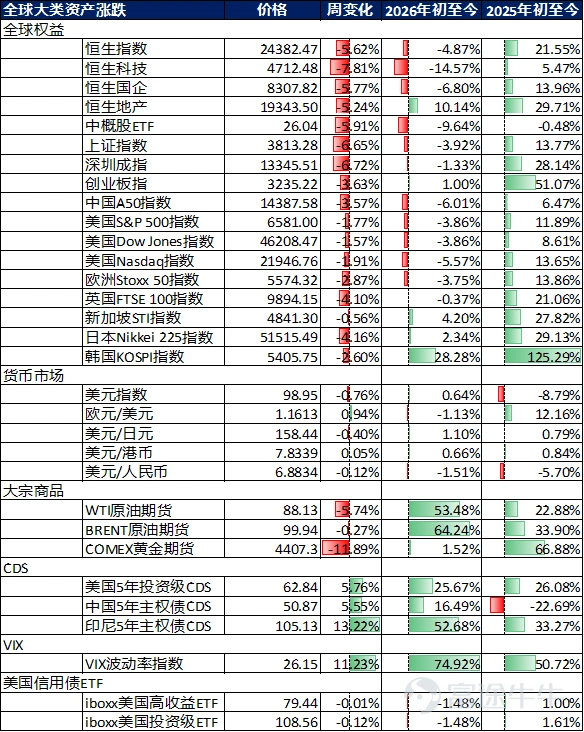
Last week (March 13 – March 20, 2026), the US stock market exhibited a triple dynamic: rising stagflation risks, tariff policy disruptions, and escalating concerns over an AI bubble. The market showed signs of 'hidden turbulence beneath a false calm,' with more covert but intensified bullish and bearish confrontations, extreme sector divergence, and a further widening split between large and small-cap stocks. Overall, the market displayed a 'volatile downtrend with localized structural differentiation.' By the end of the reporting period, the Nasdaq Composite Index closed at 21,647.61 points, falling 2.07% for the week due to concerns over an AI capital expenditure bubble, valuation corrections among tech giants, and hawkish signals from the Fed, showing characteristics of 'volatile plunges and weak consolidation,' with fluctuations increasing compared to the previous week; the Dow Jones Industrial Average closed at 45,577.47 points, falling 2.11% for the week, becoming the largest decliner among the three major indices, pressured significantly by industrial and export-oriented sectors, compounded by cost pressures from surging oil prices and tariff policy impacts, leading to widespread weakness among component stocks and multiple breaches of short-term support levels, displaying a 'testing bottom with weak rebounds' trend during the week; the S&P 500 Index closed at 6,506.48 points, falling 1.90% for the week, with a few tech giants barely supporting the index while most mid- and small-cap components performed poorly, defensive sectors like consumer and healthcare showed some stabilization signs but were insufficient to offset selling pressure from tech and cyclical sectors, exhibiting an overall 'structural imbalance and lack of resilience' trend.
In the short term, four core risk points require close attention. First, the risk of policy expectation revisions: if Fed officials release more hawkish signals subsequently or persistently soaring oil prices trigger a rebound in inflation data, it could further suppress market rate-cut expectations, triggering further corrections in tech stocks and exacerbating volatility in the broader market. Second, rising stagflation risks: the unexpected poor February non-farm payroll data combined with sharply rising oil prices, if subsequent economic data remains weak and inflationary pressures increase further, it may escalate market concerns about stagflation, prompting further capital outflows and aggravating the market downturn. Third, trade policy and geopolitical risks: significant uncertainty remains around Trump administration tariff policies, with potential escalation in state-level lawsuits and importer tax rebate claims, along with continued heating up of Middle Eastern tensions possibly pushing oil prices higher, creating dual disturbances that will further impact market risk appetite. Fourth, market structure risks: the current extreme concentration in the US stock market, AI bubble, and high-leverage option risks may trigger concentrated pullbacks in specific sectors, spreading across the entire market. Upcoming releases of key US core PCE price index, more earnings reports from tech giants, and speeches by Fed officials will become pivotal variables influencing market movements. Overall, the short-term market will remain in a phase of intertwined 'policy divergence, rising stagflation risks, geopolitical and trade disruptions, and accumulating structural risks,' with index probing for a bottom and sector divergence likely to continue, making a clear rebound unlikely in the near term.
Japan:
This week (March 13 – March 20, 2026), the Japanese stock market exhibited a three-phase characteristic: 'fading benefits of storage chips—tech sector correction—high-level pressure and volatility.' Core driving factors revolved around weakening momentum in global storage chip price increases, reversal of foreign capital flows, and unilateral weakening of the yen, compounded by profit-taking from previous highs and expanding sector divergence, resulting in imbalanced bullish-bearish confrontations and a volatile downtrend, ultimately closing the week significantly lower and ending the prior strong momentum. This week's core contradictions focused on three dimensions: first, the structural contradiction between declining prosperity in storage chips and the AI tech sector versus ongoing weakness in traditional industries; second, the contradiction between unilateral yen weakening and the stability of export-driven corporate earnings; third, the dual constraint contradiction between policy stimulus support and high debt coupled with high interest rates. At the broad market level, the overall sentiment shifted from previous optimism to caution, with heightened capital risk aversion, compounded by large-scale foreign capital withdrawals, further intensifying market selling pressure. Regarding core indices, the Nikkei 225 performed weakly throughout the week, closing sharply lower at 53,372.53 points, down 447.08 points from last week, narrowing year-to-date gains to +1.36%, ending the prior continuous uptrend, dragged down by tech sector corrections and foreign capital outflows, showing 'volatile plunges with weak rebounds' during the week, with a single-day drop of 3.38% on March 19, marking the largest daily decline this week, hitting a low of 53,190.18 points, despite brief rebounds that failed to reverse the overall downward trend. Sector performance displayed 'comprehensive pressure and increased divergence': the tech sector led the market decline, with significant drops in semiconductor and AI-related stocks, Kioxia’s share price fell over 7% during the week, weighing on the index; traditional industries continued their weak performance, with simultaneous declines in traditional manufacturing and utility sectors, while only defensive sectors like consumer and healthcare showed relatively controlled declines, failing to provide effective support to offset selling pressure from both tech and traditional sectors.
Eurozone:
This week (March 13-20), European stock markets exhibited core characteristics of 'the pan-European index fluctuating and weakening, national core indices universally declining, and a moderate escalation in the tug-of-war between bulls and bears.' The continued progress of the EU-Mercosur free trade agreement, ECB's policy stabilization measures, and structural strengthening in some niche sectors provided phased support. Meanwhile, escalating US-EU trade frictions, obstacles to Germany’s manufacturing recovery, and prolonged Middle Eastern conflicts driving up energy prices exerted primary pressure. Coupled with sector rotation differentiation (environmental protection and high-end manufacturing sectors strengthening while energy and traditional industrial sectors were under pressure), this formed a pattern of 'pan-European fluctuations declining, national indices universally weakening,' spreading market caution and increasing concerns over economic recovery. Capital flows showed features of 'structural layout, highlighting risk aversion.' At the pan-European level, the STOXX 600 Index weakened throughout the week, closing slightly lower at 573.28 points, down 25.19 points from last week, expanding its year-to-date decline to -6.17%, failing to continue the previous stabilizing trend, with upward momentum continuously weakening. According to Goldman Sachs, global hedge funds sold European stocks for the second consecutive week, holding more short positions than long in European stocks for four out of the past five weeks, somewhat heating up bearish sentiment. The trends of core national indices showed characteristics of 'universal decline, differentiated drops,' all failing to reverse the downward trend: the UK FTSE 100 Index was relatively resilient, falling slightly over the week, closing at 9918.33 points, down 399.36 points from last week, expanding its year-to-date decline to -2.99%. Supported by a temporary rebound in the energy sector and a slight retreat in inflation data, it generally presented a 'fluctuating downward, relatively strong resilience' situation; the French CAC40 Index notably declined, closing at 7665.62 points, down 270.35 points from last week, expanding its year-to-date decline to -5.67%, pressured by weak domestic consumption data, export sector burdens, and rising energy prices, showing an 'oscillating consolidation, feeble rebound' situation; the German DAX Index plummeted, closing at 22380.19 points, down 1183.82 points from last week, expanding its year-to-date decline to -8.80%, affected by obstructed manufacturing recovery and soaring energy costs, compounded by lagging impacts of a significant drop in January's new industrial orders, presenting a 'fluctuating bottoming-out, increasing selling pressure' situation, breaking below short-term support levels multiple times during the week; the Italian MIB Index also declined synchronously, closing at 42840.90 points, down 1506.66 points from last week, expanding its year-to-date decline to -5.90%, despite EU policy support and expectations of rising domestic infrastructure investment, but weighed down by rising energy prices and sluggish Eurozone economic recovery, failing to effectively alleviate market selling pressure, showing a downward oscillation.
Emerging Markets:
South Korea
This trading week, the Korean stock market displayed core characteristics of 'AI valuation correction—foreign capital profit-taking—volatile closing declines,' with core contradictions focusing on the deep game of 'AI valuation correction pressures versus bottom-fishing capital hedging,' with bullish and bearish forces repeatedly tugging, ultimately intensifying volatility and overall closing declines, fully converging upward momentum, ending the previous strong trend. On one hand, the continuous spread of the global AI wave, semiconductor industry demand resilience, and export benefits brought by won depreciation formed support, coupled with phased positive news in the semiconductor sector, leading to phased strength in leading stocks like Samsung Electronics and SK Hynix, somewhat reinforcing tech track support. On the other hand, high foreign holdings triggered market volatility, worries about AI bubbles, and high sector valuations leading to technical adjustments, with foreign capital appearing for staged profit-taking this week, single-day sell-offs reaching recent highs, further exacerbating short-term market volatility, highlighting imbalanced bull-bear tug-of-war, forming a continuation of the previous pattern of continuous foreign outflows and local capital bottom fishing. Additionally, inflation worries sparked by surging international oil prices further suppressed AI-related stock performance—these valuations are high, increasingly sensitive to changes in interest rates and liquidity expectations, further intensifying tech sector correction pressures. The Korean government's implementation of a 'petroleum price cap system' to stabilize oil prices, although attempting to alleviate energy cost pressures, failed to effectively boost market sentiment, and the stock market remained dragged by macro-environment. Core index-wise, the KOSPI Index performed weakly, falling sharply throughout the week, closing at 5584.87 points, down 207.04 points from last week, narrowing year-to-date gains to +15.37%, officially ending the strong trend within the year, presenting a 'rally-correction—oscillating bottoming-out—slight rebound' volatility feature.
India
This trading week, the core contradictions of the Indian stock market revolved around the deep game of 'external liquidity fluctuations—domestic demand support weakening,' with Fed policy expectation fluctuations causing foreign capital flow volatility and slowing domestic economic recovery momentum forming major pressures, only financial sector strong rallies and marginal warming in some consumer sectors providing weak support, ultimately presenting a 'downward oscillation, late-session stabilization' trend, with significant closing declines and year-to-date losses further expanding, thoroughly ending the phased strong pattern and continuing the worst start in ten years since the beginning of this year. Market caution was thick, investor观望atmosphere prominent, trading volumes continuously shrinking, sell pressure generally outweighing buy pressure, with bull-bear tug-of-war presenting 'weak equilibrium' characteristics; affected by high valuations, weak profits, and geopolitical risks, foreign investors continued selling Indian stocks after record outflows in 2025, further aggravating downward market pressure, with market expectations for Modi's government to introduce new economic growth catalysts to reverse current weak sentiment. Core index-wise, the Nifty 50 Index presented 'high-open-low-close—oscillating bottoming-out—late-session stabilization' three-phase characteristics, closing at 24450.45 points, down 415.25 points from last week, expanding year-to-date losses to -4.84%, continuing the previous downward trend. Sector performance showed 'polarization,' with the financial sector being the only effective support, showing relatively strong trends, becoming the core driver for late-session stabilization; IT, energy, and raw material sectors significantly corrected, dragging index performance, with the IT sector affected by global tech sector corrections and weak external demand, showing weakness; consumer sectors marginally warmed but with limited support, domestic economic recovery momentum slowing led to weak performance in domestic demand-related sectors, further aggravating market downward pressure, highlighting the fragility of India's economic recovery.
Vietnam.
This trading week, Vietnam's stock market focused on the game of 'foreign capital inflow support versus external disturbances and industrial shortcomings,' with imbalanced bull-bear forces ultimately oscillating downwards and sharply closing lower, deviating from regional market stability patterns, ending recent mild trends. On one hand, ongoing foreign inflows amid global supply chain restructuring and domestic policy support formed phased support, coupled with capacity releases from some manufacturing enterprises bringing positive news, somewhat alleviating market sell pressure; news such as Yangjie Technology's Vietnamese factory achieving full production and sales and Yadea Group's new Vietnamese factory opening briefly boosted related sector sentiments. On the other hand, Vietnam's high dependence on low-end contract manufacturing and slow industrial upgrading shortcomings became apparent, compounded by Southeast Asian stock market differentiation and short-term market volatility impacts, insufficient upward momentum to support index rise; meanwhile, weak global demand further impacted Vietnam's export-oriented industries, exacerbating market sell pressure. Core index-wise, the Ho Chi Minh Index oscillated downwards, closing at 1767.84 points, with increased weekly volatility, generally presenting an 'oscillating bottoming-out, feeble rebound' trend. From a capital flow perspective, foreign inflows significantly reduced compared to before, unable to support index rise, with clear capital flight pressures, foreign support for Vietnam's stock market continuously weakening; sector performance was weak, domestic low-end contract manufacturing affected by weak global demand, related export-oriented sectors significantly corrected, traditional manufacturing and textiles core sectors showed weak performances, further highlighting the slow industrial upgrade shortcomings, unable to adapt to global supply chain upgrade demands; only a few defensive sectors had relatively controllable declines, failing to form effective support, ultimately leading to sharp closing declines, turning from gains to losses year-to-date, performing worse than the overall regional market level.
Bond market
Past Week Review
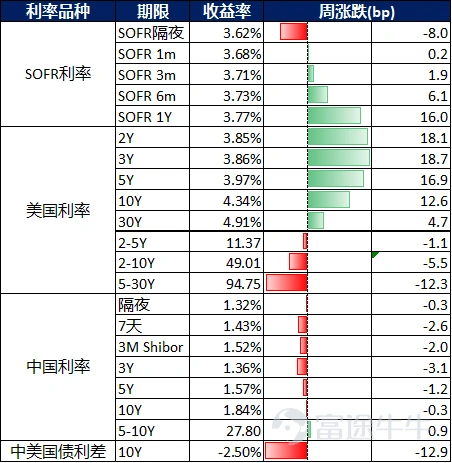
Last week within a year, the SOFR curve saw mixed movements; US Treasury yields for 2-year maturities rose by 18.1bps, and 10-year maturities rose by 12.6bps; regarding Chinese interest rates, 3-year government bond yields fell by 3.1bps, and 10-year government bond yields fell by 0.3bps. The inversion of the 10-year China-US interest rate differential stood at 250bps.
Data Source: Bloomberg and HARVEST
Government Bonds:Over the past few days, the market has been dominated by escalating geopolitical tensions and密集statements from G10 central banks. At the beginning of the week, the Reserve Bank of Australia decided to raise interest rates again, implementing back-to-back cash rate hikes; the Federal Reserve meeting also leaned hawkish, with the committee voting 11 to 1 to maintain rates (Miran voted against – not surprising). The dot plot remained consistent with December, with Fed officials still expecting one rate cut in 2026 and another in 2027; this partially explained the initial pullback in short-term yields, as the interest rate path did not undergo substantial change. However, the Summary of Economic Projections (SEP) for March revised PCE and GDP forecasts upwards, reflecting higher inflation expectations and more resilient growth. Fed Chairman Powell's remarks triggered a new round of bond sell-offs, noting that the Middle East situation (thus impacting inflation) and labor market needed more time to observe before the committee could decide the next policy direction. Although there was discussion of potential rate hikes, it was not the mainstream view. The Bank of England and the European Central Bank also leaned hawkish before the weekend, with Bailey noting that the Monetary Policy Committee was 'prepared to act' amidst rising inflation. Geopolitical tensions remained concerning: following airstrikes by the US/Israel on Iran's South Pars gas facilities—the first strike on upstream energy facilities since the conflict began—Tehran retaliated by bombing several key energy facilities in the Gulf region. Crude oil surged again, reaching $119 per barrel intraday, before retreating somewhat on positive news (e.g., Trump stating future attacks on energy facilities should be avoided and allowing some Russian crude deliveries). Data-wise, this week's schedule was relatively light, with PPI inflation being the main data point, unexpectedly stronger (0.5% MoM in February, expected 0.3%). The short-term interest rate market subsequently repriced the Fed significantly, compressing the full-year rate cut pricing to just 4bp (currently, the market expects the Fed to hike by 7bp this year). The 2-10 year US Treasury yield curve flattened bearishly overall, moving approximately +18bp to +10bp, with similar moves in SOFR OIS of +21bp to +11bp. Looking ahead to next week, continued attention should be paid to more official statements post-Fed meetings, with the Middle East situation remaining the primary risk factor for the market.
Credit bonds:Investment-grade dollar bonds saw overall spreads narrow slightly by 1-2bp this week. Within the week, the March FOMC meeting maintained rates, but Fed Chair Powell's subsequent hawkish remarks, combined with ongoing Middle Eastern geopolitical conflicts pushing up inflation expectations, led to a sustained rise in US Treasury yields, with benchmark rate increases driving buying demand from absolute yield-focused investors. In specific sectors, the TMT sector entered its Q3 earnings announcement period this week, with Tencent Music's 5-year dollar bond spread widening by 2bp post-results compared to last week, Weibo's 5-year dollar bond spread widening by 5bp post-results, and Tencent's 5-year dollar bond spread narrowing by 2bp post-results. In the financial sector, floating-rate bonds from Chinese banks and brokers saw buying interest, with benchmark floating-rate bond spreads narrowing by 1-2bp. Hong Kong issuers saw minor widening, with Link REIT’s 10-year dollar bond spread widening by 2bp and Hongkong Electric's 10-year dollar bond spread widening by 1bp.
Outlook:Fed officials decided on Wednesday this week by an 11-1 vote to keep the federal funds rate target range unchanged at 3.50-3.75%. One official dissented, with Fed Governor Miran voting to cut rates by 25bp. Comparing the March and January Federal Open Market Committee (FOMC) meeting statements, we recognize three core changes in the March statement compared to January: 1) A more neutral description of the unemployment rate; 2) New attention to uncertainties in the Middle East situation; 3) Narrowed internal dissent (opposing votes decreased from two to one). Overall, the FOMC maintained a cautious wait-and-see stance, but Middle Eastern geopolitical risks were formally raised as a policy consideration factor. In the short term, the Middle East situation and oil prices remain the primary drivers of global financial markets.
Several observations: 1) The US made multiple efforts to ease the upward trend in oil prices — US Treasury Secretary Bessent stated that the Trump administration issued a 30-day sanctions waiver on Friday, allowing purchases of Iranian oil at sea. This is the third temporary sanctions waiver by the US within about two weeks, permitting sales of Iranian crude and petroleum products loaded onto vessels from March 20 to April 19; previously, the US had eased sanctions on Russian oil. Bessent stated, “By temporarily releasing these existing supplies globally, the US will quickly inject about 140 million barrels of oil into the global market”; earlier, Bessent told Fox Business on Thursday, “Depending on different calculations, this equates to 10 days to two weeks of supply.” Additionally, President Trump said on March 19 that he had instructed Israel not to attack Iran’s natural gas infrastructure again because retaliatory strikes against energy facilities caused a sharp rise in energy prices, significantly escalating US-Israel military conflict with Iran. 2) Trump stated that US military objectives in the Middle East were nearing completion — Trump posted on Truth Social on March 21, “Our great military operation against the Iranian terrorist regime in the Middle East is nearing completion, with objectives close to being achieved: (1) Completely destroying Iran's missile capabilities, launch installations, and all related facilities. (2) Destroying Iran's defense industrial base. (3) Eliminating its navy and air force, including air defense weapons. (4) Never allowing Iran to approach nuclear capability and always ensuring the US can respond swiftly and strongly if such situations arise. (5) Protecting our Middle Eastern allies at the highest level, including Israel, Saudi Arabia, Qatar, the UAE, Bahrain, Kuwait, etc. The Strait of Hormuz must henceforth be guarded and patrolled by other countries using the strait — the US does not use this strait! If needed, we will assist these countries in maintaining security in the Strait of Hormuz, but once the Iranian threat is eliminated, this should no longer be necessary. Importantly, for these countries, this will be an easy military task.” 3) The US continues to increase troops in the Middle East — the Pentagon is accelerating the deployment of thousands of additional Marines and sailors to the Middle East, while speculation grows that the Trump administration might send ground forces to Iranian territory. According to multiple reports, the 11th Marine Expeditionary Unit (MEU), consisting of at least 2200 Marines, departed San Diego aboard the amphibious assault ship USS Boxer on Wednesday (March 18), leaving the US about three weeks ahead of schedule. These additional Marines will arrive in the Gulf region less than a week after another MEU, the 31st, comprising 2200 Marines and sailors, departs for the region from Japan aboard the USS Tripoli. 4) The US shows interest in acquiring Kharg Island — US Treasury Secretary Bessent told Fox Business on Thursday, “We'll see whether Kharg Island eventually becomes a US asset.”
Overall, US President Trump seems intent on ending the war, but two variables are worth noting: first, Israel may not want the military conflict to end prematurely and could take actions to disrupt the easing situation; second, the US might again be employing a delaying tactic until the 11th and 31st Marine Expeditionary Units are deployed. In this light, the situation in the Middle East may ease in the short term but remain generally deadlocked. After the US Marine Corps is in place, the US may not rule out initiating island-seizing combat, potentially making the situation more tense. If the two Marine Expeditionary Units arrive in the Gulf region for a ground offensive that does not go smoothly, the US dollar will weaken, possibly leading to a triple sell-off in dollar-denominated stocks, bonds, and currency. The market needs to closely monitor changes in the Middle Eastern situation and inflation data in the coming months while preparing more thoroughly for a 'steady and high for longer' interest rate environment.
Foreign exchange market
Offshore Renminbi: This week, the RMB interest rate curve moved further upward. In the money market, the People's Bank of China injected a cumulative 65.8 billion yuan through 7-day reverse repos in open market operations this week, while withdrawing 100 billion yuan via scaled-down 6-month outright reverse repos. Liquidity remained loose, with tax payments not having any impact, and the 7-day repo fixing rate fell by 3 basis points from last Friday to 1.49%. In terms of long-term rates, repo IRS was mainly influenced alternately by inflation expectations and risk aversion sentiment, with a slight increase overall for the week. Over the weekend, tensions between the US and Iran continued to rise, causing oil prices to jump higher on Monday, intensifying concerns about imported inflation. Combined with better-than-expected industrial, consumption, and investment data for January-February released in the morning, repo IRS quickly steepened. From Tuesday to Thursday morning, the stock-bond seesaw effect relatively dominated bond market movements, with spot bonds recovering under risk aversion, causing repo IRS to flatten downward. From Thursday afternoon to Friday, the interest rate market was once again dominated by inflation concerns. As oil prices surged, repo IRS rapidly steepened upward by 1-2 basis points Thursday afternoon.
US Dollar:The ongoing war in the Middle East continues to dominate market sentiment, with oil prices rising above $100 again and bond yields climbing. The revised GDP figure for the fourth quarter in the US dropped sharply to 0.7%, and central banks around the world are struggling to balance the risks of inflation concerns and demand destruction. Despite escalating geopolitical risks and soaring oil prices, the Federal Reserve signaled this week that future rate cuts remain a priority while keeping rates unchanged. From this perspective, the Fed showed an optimistic stance in its Summary of Economic Projections (SEP) — raising forecasts for US GDP and inflation but still planning to cut rates later this year. Despite a stronger-than-expected 0.7% increase in February's PPI, suggesting persistent supply chain pressures, Fed Chair Powell indicated the Fed is 'looking through' the current energy shock, focusing instead on the resilient labor market. Following a front-end selloff triggered by strong PPI inflation and a hawkish press conference, the US Dollar Index (DXY) strengthened again, with USD/JPY nearing the 160 integer level ahead of the Bank of Japan decision and the Pence-Trump summit held on the same day. Additionally, the aftermath of the attack on Iran’s South Pars refinery warrants attention, as it may become a significant turning point in the Middle East conflict.
Macroeconomics
China:
Under the disturbance of geopolitical conflicts, international oil prices have continued to rise, domestic energy prices, some chemical products, and agricultural product prices have kept increasing, but production and investment activities have marginally slowed down. In terms of high-frequency data, after aligning with the Lunar calendar, the progress of national construction site resumption in the fourth week after the holiday has been slower than the same period last year. Semi-steel tires, aluminum profiles, and asphalt plants are weak overall, and real estate transactions have slowed down year-on-year. The broad fiscal policy remained loose in January-February to support a good start for 2026. This week, we focus on the industrial enterprise profit data for January-February.
In terms of high-frequency economic activity, last week residents' mobility remained highly robust, while construction starts were flat, and the resumption of work and production lagged behind the same period of the Lunar New Year. Real estate transactions slowed year-over-year, and the Spring Festival effect dragged March exports lower. In financial markets and funding costs, interbank liquidity remained loose, and the exchange rate of the RMB against the US dollar appreciated slightly. Interbank rates declined overall, with DR007/R007 falling by 4.1/2.6 basis points respectively; the yield curve of government bonds steepened. Last week, net issuance of interest rate bonds and financing in the real estate bond market increased year-over-year, while equity financing decreased somewhat. On the exchange rate side, the RMB appreciated 0.08% against the US dollar and 0.29% against a basket of currencies last week.
Regarding important economic data and macro events, data: 1) A good start for 2026: Industrial added value growth for January-February strengthened to 6.3% year-over-year from 5.2% in December last year; retail sales/fixed asset investment also rebounded to 2.8%/1.8% year-over-year. 2) Broad fiscal loosening supports a strong start in January-February: The year-over-year decline in broad fiscal revenue narrowed to 1.4% from 18.5% in December last year; year-over-year growth in broad fiscal expenditure turned positive at 6.1% from -0.7% in December. Events: 1) On March 13, the Fifteenth Five-Year Plan outline set a goal to double the economy by 2035, proposing 20 major goals and 102 key projects. 2) On March 15-16, Sino-US trade consultations reached a series of outcomes on tariff arrangements, bilateral trade and investment, and maintaining existing consultation consensus.
United States:
The Fed meeting this week, the continued fermentation of February’s non-farm payroll data, rising tensions in the Middle East pushing up oil prices, and the formal implementation of a 15% global tariff constituted the core factors driving market dynamics this week. Among these, the heightened risk of stagflation and narrowing but still hawkish divergence in Fed policy became the central contradiction, replacing previous extreme divergences and becoming the core variable affecting market sentiment.
On the Fed front, the two-day FOMC meeting concluded on March 19, announcing the decision to maintain the federal funds rate target range between 3.5% and 3.75%, marking the second consecutive time this year that rates were left unchanged, consistent with market expectations. This FOMC meeting sent a notably hawkish signal, with the dot plot indicating that committee members widely expect only one rate cut (totaling 25 basis points) in 2026. Seven of the 19 FOMC members now project no rate cuts this year, up from six in December, further shrinking the 'dovish' camp. The long-term equilibrium rate was raised from 3.0% to 3.1%, implying a prolonged high-interest-rate environment, with the timing of rate cuts likely pushed back. In the press conference, Fed Chair Powell stated that rising energy prices in the short term will push up overall inflation, with uncertainty remaining regarding the scope and duration of the impact. He emphasized that without progress on inflation, rate cuts will not occur, and rate hikes are not ruled out. Monetary policy has no preset path and will be decided meeting by meeting based on economic data. Meanwhile, the potential impact of Trump nominating Kevin Warsh as Fed Chair is still unfolding, with market concerns over possible policy adjustments increasing uncertainty. According to CME's 'FedWatch,' the market's probability of no rate cuts this year rose to 56.1%, with a 3.6% chance of a rate hike, further contracting rate-cut expectations.
Regarding core economic and market dynamics, the US implemented a 15% global import tariff this week, effective for 150 days. Essentially a political maneuver by Trump to boost his election campaign, this temporary tariff did not genuinely address the US trade imbalance. Data shows that the US merchandise trade deficit reached a record high of $1.2409 trillion in 2025, a 2.1% increase year-over-year. Instead of balancing trade, tariffs have shifted 90% of the costs onto American businesses and consumers, continuously driving up inflation and suppressing consumption and investment vitality. Currently, over 20 US states have filed lawsuits, and importers' demands for tax rebates are growing. The short-term nature and uncertainty of the tariff policy severely disrupted market sentiment, notably weighing on export-oriented sectors and further exacerbating market volatility.
Japan:
This week, the volatility of the yen exchange rate, the monetary policy of the Bank of Japan, and changes in the prosperity of the technology industry are the three key factors driving the core dynamics of the market. Among these, the decline in prosperity for memory chips and AI tech sectors, coupled with structural contradictions from sluggish traditional industries; the contradiction between the unilateral weakening of the yen and the stability of export companies' profitability; and the dual constraints of policy support versus high debt and high interest rates have emerged as the most critical issues. These three contradictions intertwine, continuously disturbing market sentiment, constraining upward market momentum, and pushing indices into a volatile downtrend. On the monetary front, the unilateral weakening of the yen dominates market sentiment. While the Bank of Japan maintains policy stability, diverging expectations have further exacerbated market fluctuations. This week, the yen weakened unilaterally against both the US dollar and the renminbi, closely aligned with the US-Japan interest rate differential and global dollar liquidity expectations. This directly impacts the profitability and stock performance of Japanese export companies—while a weaker yen can boost foreign exchange gains for exporters in the short term, over the long term, one-sided currency fluctuations increase uncertainty around corporate earnings, raising concerns about the stability of export company profits, thus dragging down related stock performances. On March 19 local time, the Bank of Japan held a monetary policy meeting and decided to keep the current policy rate steady at around 0.75%, making no new moves toward monetary policy normalization, consistent with market expectations. The continuation of a 'steady and stable' policy stance aims to provide phased support to markets but has failed to effectively alleviate market concerns. Meanwhile, there is significant divergence in market expectations regarding the Bank of Japan's future policy path: the International Monetary Fund (IMF) previously issued a report warning that the Bank of Japan should maintain its independence and continue exiting from monetary easing, aiming to bring the policy rate to a neutral level by 2027. In contrast, recent signals of tax cuts from Japanese Prime Minister Sanae Takagi have triggered intense volatility in the bond and currency markets, causing the yen to weaken sharply and long-term interest rates to rise significantly, further exacerbating worries about policy uncertainty. This divergence in policy expectations has become a key factor disrupting market sentiment.
Europe:
The conclusion of this week’s European Central Bank (ECB) monetary policy meeting, progress on the EU-Mercosur Free Trade Agreement, rising US-EU trade tensions, weak German manufacturing data, and prolonged conflicts in the Middle East pushing up energy prices are the five major factors shaping the core dynamics of the market this week. Among these, the contradiction between ECB policy stabilization and weak economic recovery, along with external disruptions (trade frictions, energy prices) clashing with internal fundamental weaknesses, have emerged as the most crucial issues, continuously disturbing market sentiment and constraining upward market momentum.
On the monetary front, on March 19 local time, the European Central Bank held a monetary policy meeting and decided to keep the three key interest rates unchanged, with the deposit facility rate, main refinancing rate, and marginal lending rate remaining at 2.00%, 2.15%, and 2.40% respectively, consistent with market expectations. This continues the previous 'steady and stable' policy tone, aiming to provide phased market support. In a press release issued the same day, the ECB stated it remains committed to ensuring inflation stabilizes at the 2% target level in the medium term. Currently, eurozone inflation levels are generally close to the 2% target, and long-term inflation expectations remain stable. The economy has shown some resilience recently. However, the ECB warned that conflicts in the Middle East have increased uncertainty in the economic outlook, pushing up energy prices and posing upside risks to inflation while exerting downward pressure on economic growth. In the short term, rising energy prices will significantly impact inflation, with medium-term effects depending on the duration of the conflict and its transmission effects on the economy. Recent statements by ECB officials have been 'neutral to dovish,' emphasizing that the current monetary policy stance can effectively address potential shocks while cautioning about the dual risks of inflation rebound and economic slowdown due to prolonged Middle East conflicts and escalating US-EU trade tensions. According to the latest forecasts by ECB staff, inflation levels for 2026 to 2028 are projected at 2.6%, 2.0%, and 2.1% respectively, revised upwards mainly due to rising energy prices. Meanwhile, growth forecasts for the same period are 0.9%, 1.3%, and 1.4%, revised downwards from previous estimates. Market participants remain divided on the ECB’s future policy path: some believe that core inflation in the eurozone will gradually ease, potentially opening a window for rate cuts in the second half of the year. Others argue that volatility in energy prices and trade friction disruptions may slow the pace of inflation decline, leading the ECB to maintain its current policy stance in the near term without meeting the conditions for rate cuts.
Global cyclical phase synchronization indicators:
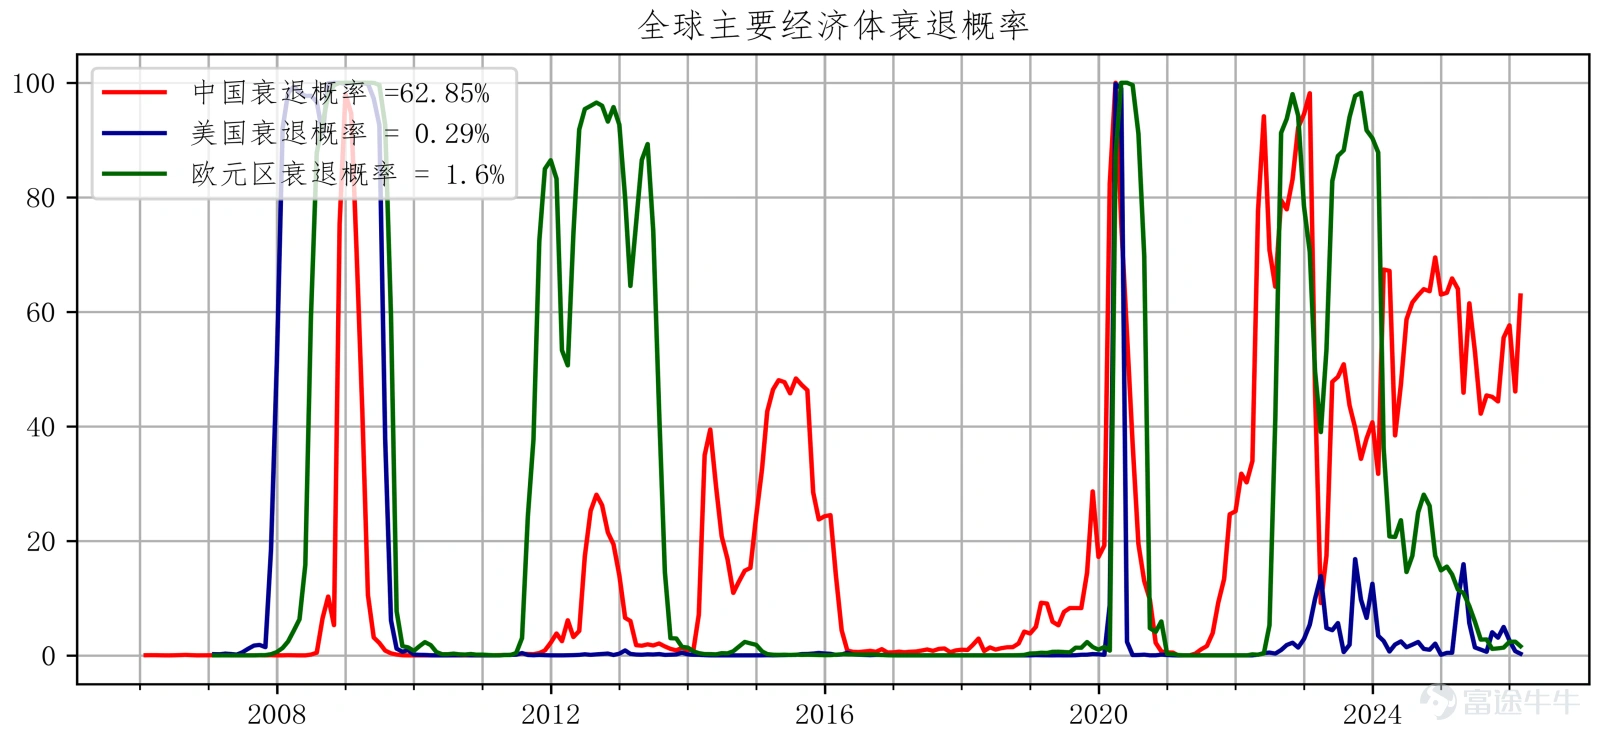
China remains on the edge of recession; the probability of a US recession is low; Europe emerges from recession.
Data Source: Bloomberg and HARVEST
– China:Year-over-year real estate sales, year-over-year new real estate starts, year-over-year M1, year-over-year electricity generation, PMI new orders, auto sales
– United States:Unemployment-related indicators, real estate pre-sale permits, auto sales, consumer expectations, investor sentiment, new orders, stock drawdowns
– Eurozone:Economic activity indicators, real estate pre-sale permits, consumer confidence, manufacturing PMI, services PMI, credit spreads, stock drawdowns
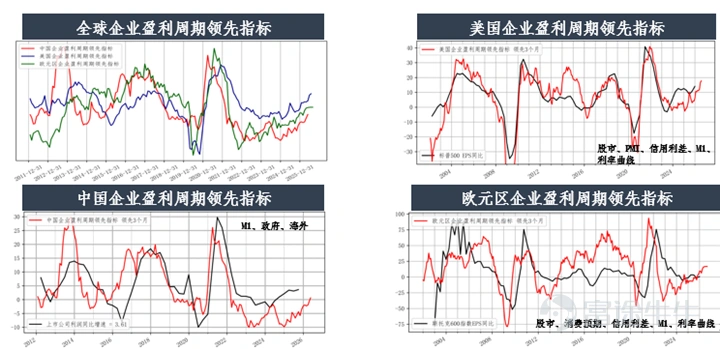
Leading indicators of the global corporate earnings cycle
Growth LEI: Q1 China's economy may recover; European corporate earnings growth has stabilized; US corporate earnings growth is upward.
Data Source: Bloomberg and HARVEST
Disclaimer:
Investment involves risks, including possible loss of principal. Past performance or any forecasts or expectations do not indicate future performance. Before making investment decisions, investors should review relevant sales documents, including risk disclosures. Investment returns not denominated in Hong Kong dollars or US dollars are subject to exchange rate fluctuations.
The interests of this company are not offered or sold in Hong Kong through advertisements, invitations, or any other documents, except in cases where it does not constitute a public offering. This document has not been approved under the Securities and Futures Ordinance or the Companies Ordinance and is intended solely for authorized persons. It must not be distributed to unauthorized persons in Hong Kong or to unauthorized persons in any other jurisdiction. This material has not been reviewed by the Securities and Futures Commission of Hong Kong. For the purposes of this statement, 'authorized persons' shall mean professional investors as defined under the Securities and Futures Ordinance whose ordinary business involves purchasing, selling, or holding securities (whether as principals or agents). Distribution of this material may be restricted in certain jurisdictions.
In cases where it would be illegal to make an offer to any person within a jurisdiction, this document shall not be deemed as an offer or invitation to such persons. This document is for reference only and does not constitute any investment advice or recommendation, nor does it constitute an offer or invitation. It is not a basis for contracts involving the purchase or sale of any securities or instruments, nor is it a basis for Harvest Fund Management Co., Ltd., Harvest Global Investments Limited, or their affiliates to enter into or arrange any type of transaction based on the information contained herein.
Although the third-party information provided above is sourced from what should be reliable sources, neither Harvest Fund Management Co., Ltd., Harvest Global Investments Limited, their authorized issuers, affiliates, nor any of their directors or employees shall bear any responsibility for any errors or omissions therein. The information and opinions expressed herein are for reference only and may be adjusted without notice, and therefore should not be relied upon for making investment decisions. You should consult your investment advisor before making any investment decision.
The issuer of this document is Harvest Global Investments Limited. This document belongs to Harvest Global Investments Limited, which holds the copyright. Further circulation of this document is prohibited without the written consent of Harvest Global Investments Limited. All rights reserved.
All rights reserved ©2026 Harvest Global Investments Limited
Risk Disclaimer: The above content only represents the author's view. It does not represent any position or investment advice of Futu. Futu makes no representation or warranty.Read more
Comments
to post a comment
2