

Earnings reports from Chinese giants raise concerns! Is it a good time to buy on dips?
Key support approaching, can Tencent stage a recovery?
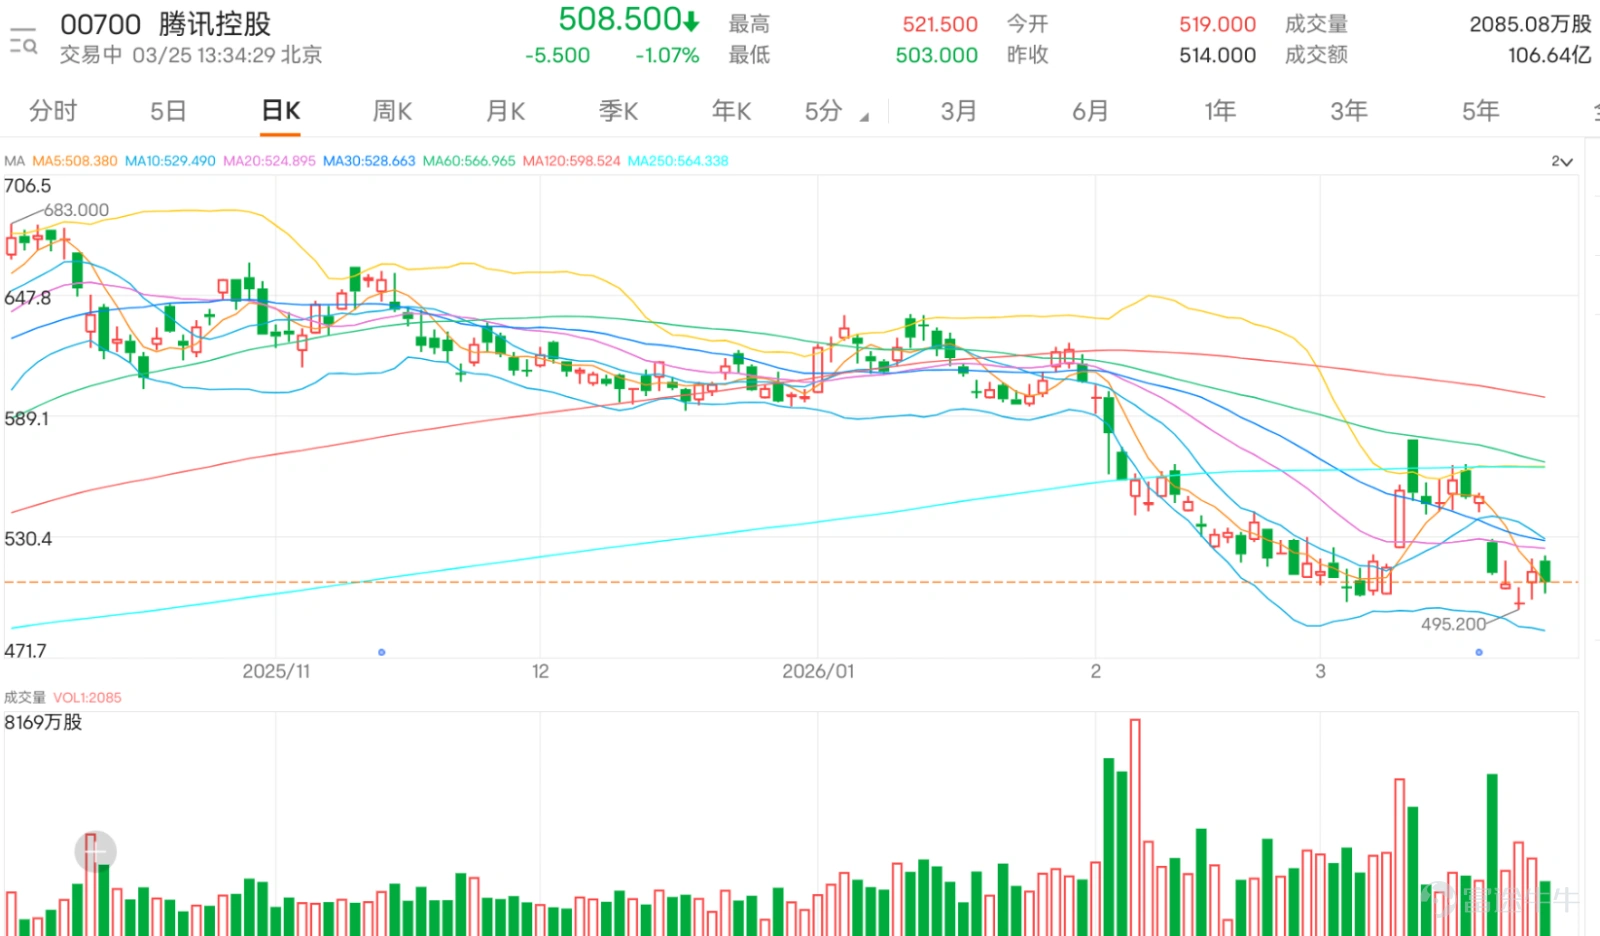
$TENCENT (00700.HK)$ Today's market saw an initial rise followed by a pullback. The stock tested 521.5 yuan in the morning session before retreating with volatility, hitting a low of 503 yuan during the trading session, continuing its previous short-term correction pattern. From the perspective of the moving average system, the stock price has clearly broken below all major moving averages. The 10-day line is at 529.19 yuan, the 30-day line at 528.56 yuan, and the 60-day line at 566.92 yuan. The moving averages are arranged in a bearish pattern, and the stock price is significantly lower than the clustered area of the averages, reflecting a weak medium-term trend and indicating that selling pressure in the market has not been fully released.
In terms of support and resistance levels, Tencent's key price boundaries are very clear: immediate support below is at 490 yuan, and if it fails to hold, the stock may further drop to test the long-term support level at 454 yuan. Resistance above is located at 540 yuan and 566 yuan, with the 566-yuan level closely aligning with the 60-day moving average, forming an important mid-term pressure zone. Currently, the stock price is nearing the first support level; if sufficient buying emerges at this position, there could be potential for a short-term technical rebound.
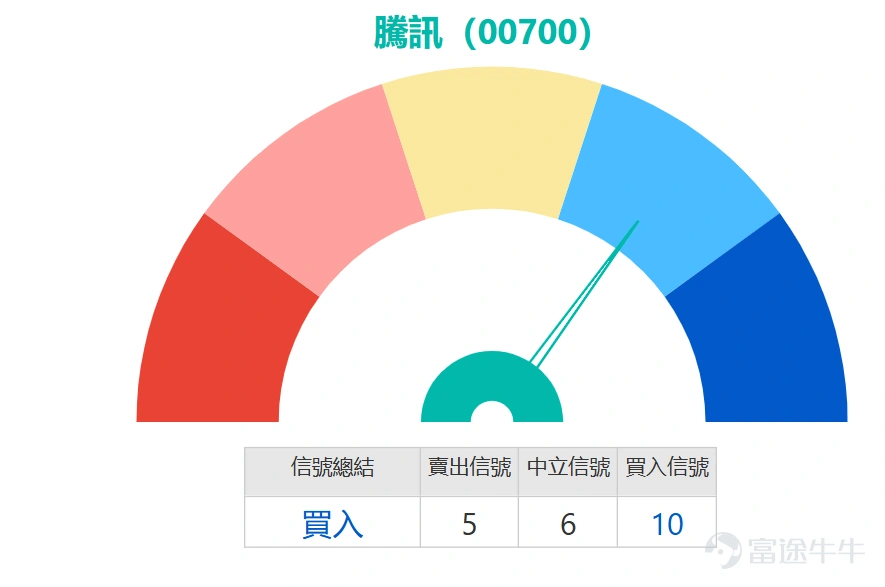
On the technical indicator front, there is evident signal divergence: the Stochastic Oscillator is currently giving a sell signal, indicating that short-term momentum remains weak. The CCI indicator is neutral, offering no clear direction. The RSI reading stands at 40, close to the oversold region but not yet in an extreme state. The Williams %R indicator also shows oversold conditions but leans toward neutrality, reflecting that overall downward momentum has slowed somewhat. Notably, the ADX indicator has issued a buy signal, while the VR trading ratio indicator suggests 'severe oversold conditions, possible bottom formation,' providing a clear buy recommendation. This aligns with the quantitative system summary of a 'buy' signal (strength 10), showing that some oscillators have started signaling rebound opportunities.
However, trend indicators remain cautious: MACD, Ichimoku Cloud, and Bollinger Bands continue to issue sell signals, while the Rate of Change (ROC) indicator also shows a sell signal, reflecting that medium-term adjustment pressures have not yet fully abated. Overall, after consecutive declines, Tencent’s stock presents a typical divergence between short-term and medium-term signals: short-term oscillators indicate oversold repair needs, but trend indicators continue to suppress rebound potential.
The changes in derivatives street volume over the past three trading sessions further confirm structural adjustments in market expectations. Call warrant street volume remained at high fluctuations, recording 9993.69 million contracts on March 20, slightly rising to 10077.87 million contracts on March 23, and dropping to 9929.37 million contracts on March 24, consistently staying near the 10,000 million contract level, showing that long-term bullish positions have not seen significant withdrawal. In contrast, put warrant street volume fell sharply, from 447.94 million contracts on March 20 to 329.83 million contracts on March 23, maintaining a relatively low level of 335.51 million contracts on March 24, reflecting that short-term bearish forces have contracted noticeably.
In the bull and bear certificate market, there has been an even more extreme change in positions: the street volume of bull certificates slightly decreased from 1,654.68 million units on March 20 to 1,610.32 million units on March 23, and then sharply dropped to 1,026.18 million units on March 24, with leveraged funds that were short-term bullish taking significant profit. Meanwhile, the street volume of bear certificates steadily increased, slightly rising from 194.1 million units on March 20 to 194.31 million units on March 23, and further increasing to 203.45 million units on March 24, indicating that short sellers are gradually positioning themselves for a potential pullback. Overall, the changes in the derivatives market align closely with Tencent's recent volatile trading at high levels, where long-term bulls maintain their positions while short-term funds tend to take profits, signaling that the stock price may enter a period of consolidation.
Based on a comprehensive analysis of various indicators, Tencent currently shows a 'buy' signal on the technical side, with a signal strength of 10. However, multiple trend indicators still lean bearish, suggesting that the upcoming rebound process may be challenging. For professional investors, it may be worth considering a phased entry around the support level of HKD 490 to capture a technical rebound, but strict stop-loss should be set below the support level of HKD 454, while closely monitoring the breakout situation at the resistance level of HKD 540. The current quantitative model suggests an upward probability of 54%, indicating a slight advantage for a rebound opportunity, but the market still needs further catalysts to reverse the overall weak trend.
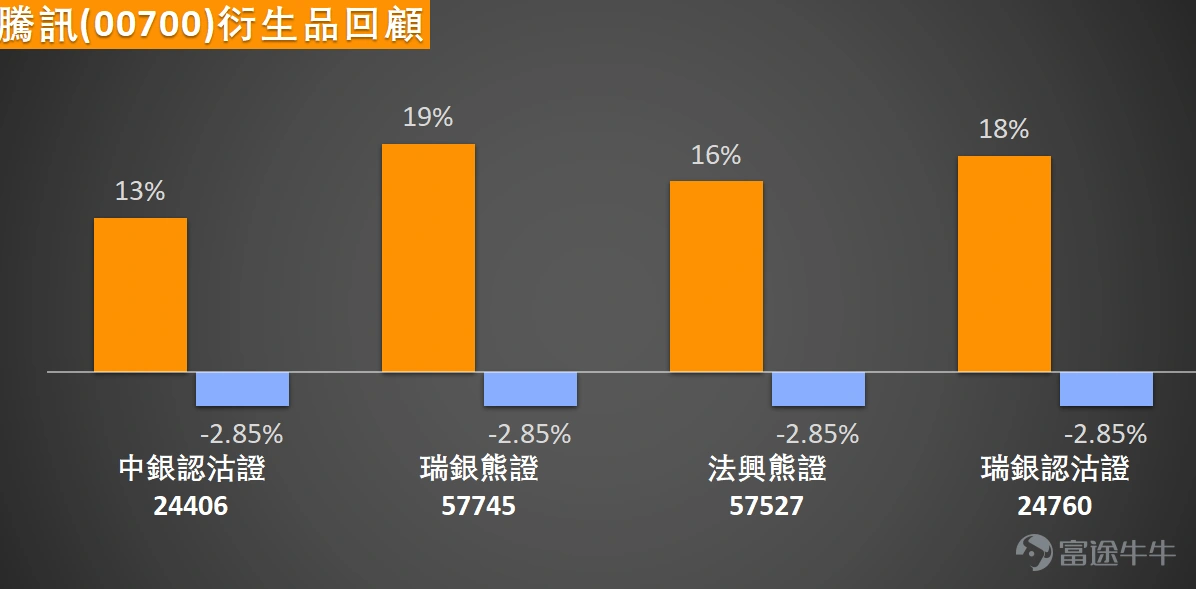
Looking back at March 19, Tencent's stock fell by a cumulative 2.85% over the two days after being mentioned, during the same period $SG#TENCTRP2812H.P (57527.HK)$ 、 $UBTENCT@EP2606B.P (24760.HK)$ 、 $UB#TENCTRP2812R.P (57745.HK)$ 、 $BITENCT@EP2606B.P (24406.HK)$ the average increase of four related products reached 16.5% over the two trading days following the mention date; the performance of these bearish derivatives fully matched the fluctuations of the underlying stock, effectively reflecting their hedging attributes against downside risks.
If you expect the stock price to rebound above the support level of HKD 490, you can consider products with higher leverage, such as $UB#TENCTRC2608L.C (65940.HK)$ , with a recovery price of HKD 489 and a leverage of approximately 18 times or $BI#TENCTRC2612K.C (62650.HK)$ , with the same recovery price of HKD 489 and a leverage of about 15.5 times, both offering efficient ways to participate directly in the rebound. Conversely, if you're bearish and think the rebound won't last, you can focus on products with notable actual leverage and low premiums like $JP#TENCTRP2810F.P (61128.HK)$ , with a recovery price of HKD 559 and a leverage of approximately 11.8 times, or the product with the lowest premium, $UB#TENCTRP2812S.P (61361.HK)$ , with the same recovery price of HKD 559.
For investors who prefer options structures, if you anticipate the rebound will challenge recent moving average resistance, you might consider products with relatively lower implied volatility. $SGTENCT@EC2606A.C (16022.HK)$, with a strike price of 530.5 yuan or the lowest implied volatility$MSTENCT@EC2606C.C (15921.HK)$, with a strike price of 530.5 yuan, to capture upside potential at a lower cost. If concerned about the breakdown of key support levels, put warrants can be deployed as hedging or bearish instruments, such as those with the lowest premium$BITENCT@EP2606A.P (23122.HK)$, with a strike price of 499.8 yuan or relatively lower implied volatility$UBTENCT@EP2606A.P (21984.HK)$with a strike price of 499.8 yuan.

$Hang Seng Index (800000.HK)$Under pressure at highs, Tencent faces both short-term oversold signals and medium-term trend resistance. Would you choose to position on the left side or wait for trend confirmation? Feel free to share your insights in the comment section. For more market analysis, stay tuned to 'HK Stock Warrants Jenny' daily updates!$Hang Seng TECH Index (800700.HK)$$Hang Seng China Enterprises Index (800100.HK)$
Reminder: This article does not constitute any investment advice.
This article is for reference only and does not constitute any investment advice. The market data, opinions, and analysis contained herein may change at any time without prior notice. We are not responsible for any loss or damage caused by reliance on the information in this article. Technical analysis only shows whether certain technical conditions are met; a comprehensive assessment of asset performance should be conducted using additional data. Decisions to trade should not be based solely on this article. Please note that past performance is not indicative of future results.
#HongKongStocks #RealTimeAnalysis #WarrantsSelection #WarrantsStrategy #DerivativesHedging #HongKongWarrantsJenny #Tencent #00700 #TechStocks #TechnicalAnalysis
Risk Disclaimer: The above content only represents the author's view. It does not represent any position or investment advice of Futu. Futu makes no representation or warranty.Read more
Comments
to post a comment
1