

Pop Mart plans to launch new products! Can the IP giant capitalize on this opportunity?

March 24th [HK Stocks Podcast] Part 1 - Hang Seng Index, Pop Mart, AIA,
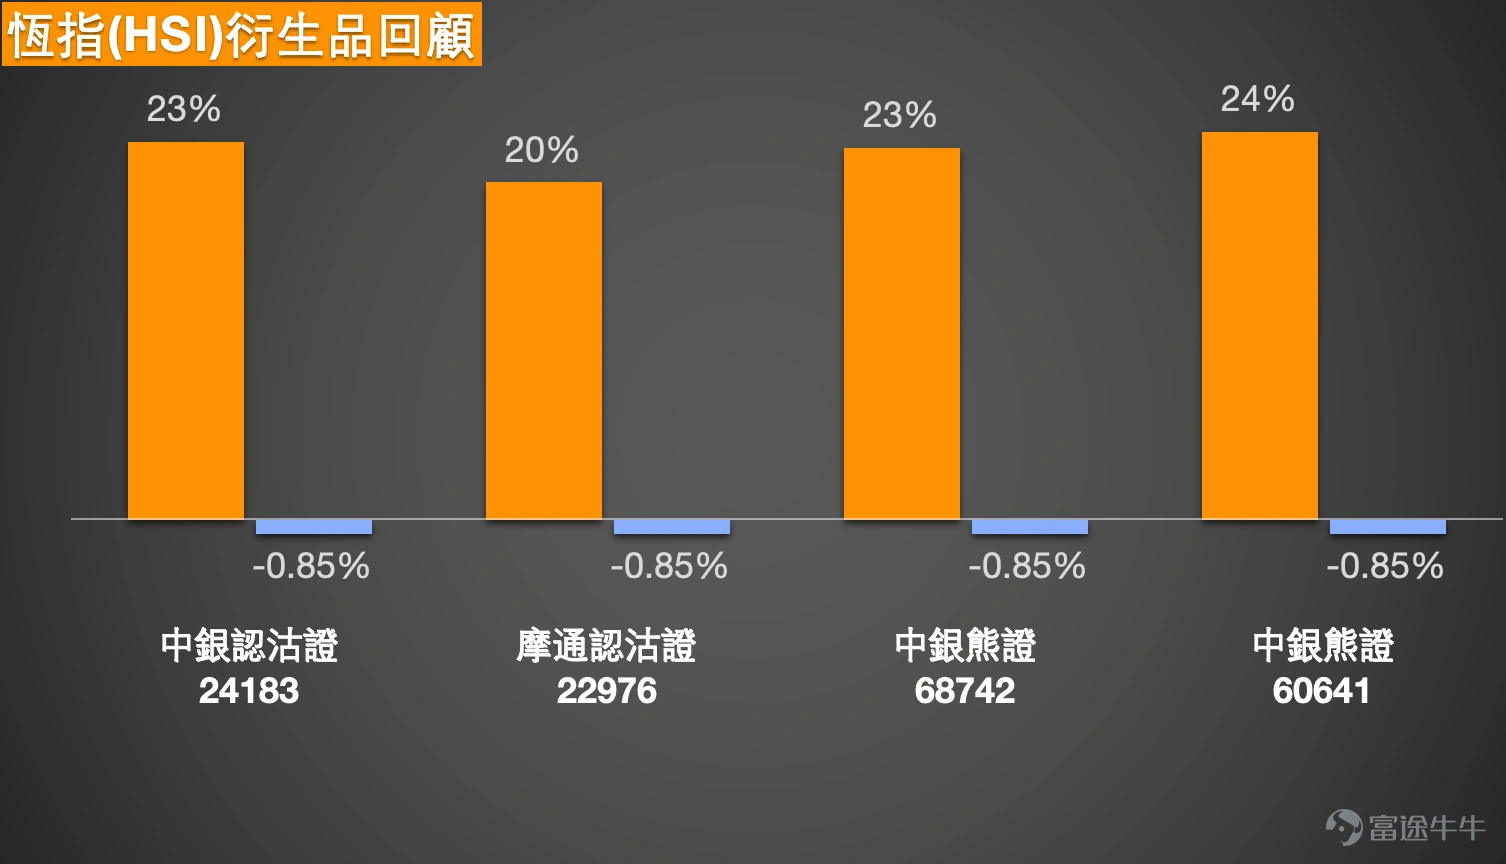
1. Hang Seng Index: Bullish investors are waiting for the index to rise above 26,000 points and are choosing bull certificates with a recovery price of 24,000 points; bearish investors believe the gap has been filled, predicting another drop tomorrow, and are opting for bear certificates.
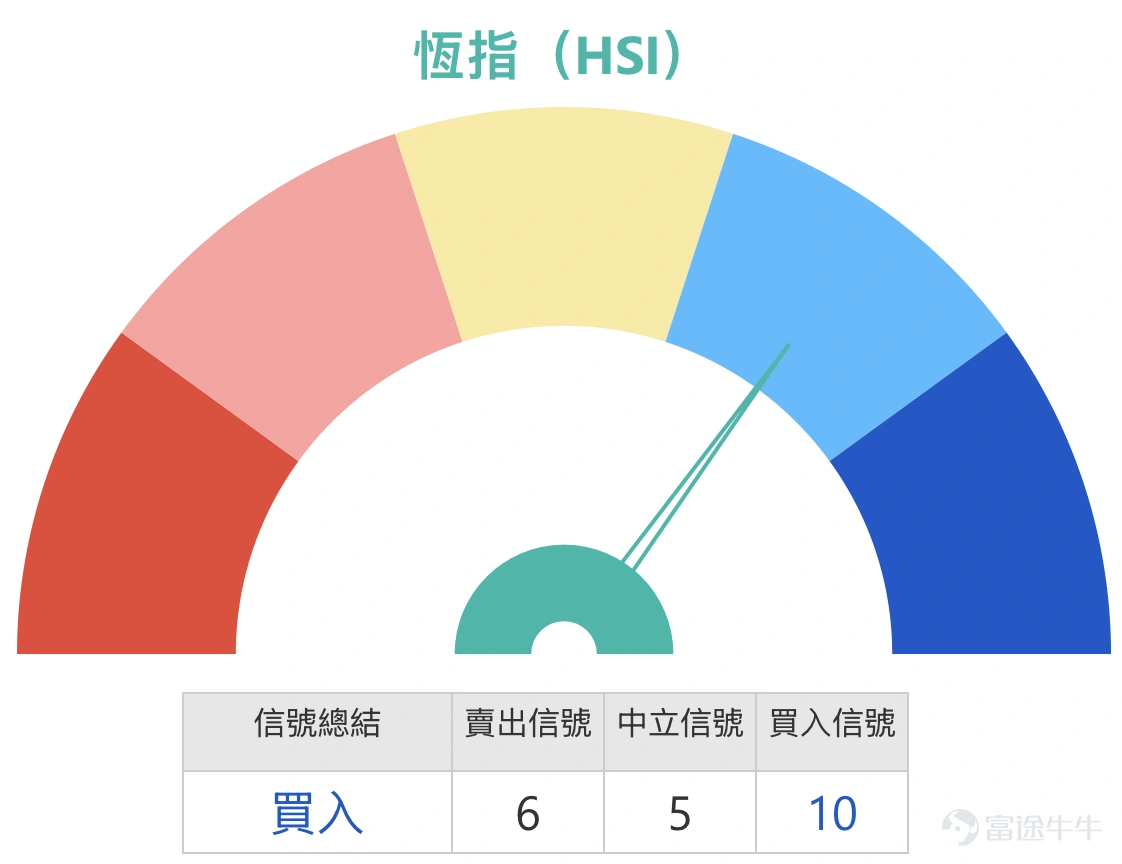
The Hang Seng Index is currently at 25,063 points and remains in the recovery phase after falling from 28,056 points. However, this can only be considered a weak rebound and not a true sign of strength. Recently, the clear trading range has been between 24,203 and 28,056 points, with an overall volatility of approximately 15.9%. From a short-term trading perspective, the nearest support level to watch is the 24,700 to 24,203-point region, as 24,203 points represent a recent significant low, and the current price has just rebounded from that low. The resistance above is around 25,239 points, followed by the 25,500 to 25,700-point region, which is close to multiple short-to-medium term moving average pressures and is also the key area determining whether further recovery can occur in the short term.
In terms of technical status, the moving averages remain downward overall, with the 5-day, 10-day, 20-day, and 30-day lines yet to show a clear bullish alignment, indicating that the broader trend has not escaped weakness. Although the Relative Strength Index (RSI) has recovered from a low, it remains in a weaker zone without any strong signals. Regarding the Bollinger Bands, the index continues to run near the lower band, implying that while there may be a short-term technical rebound, the overall situation remains within a weak zone rather than transitioning into a strong zone.
To continue advancing, the conditions are straightforward: the index must first stabilize effectively above 25,000 points, then break through 25,239 points and subsequently reclaim the resistance zone between 25,500 and 25,700 points. Only by achieving this step will the market have the potential to push back toward 26,000 points. If the index merely hovers around 25,000 points or rises to the 25,200 to 25,300-point range before facing resistance again, such movement should still be regarded as a weak rebound and insufficient to support a quick return to 26,000 points.
The downside risk is equally clear. If the index falls back below the 24,700-point level and subsequently breaches the 24,203-point support again, it would indicate that this rebound has failed, and the market will return to a bottom-searching pattern. Since the moving averages are still trending downward, any breakdown of lower support could trigger further selling pressure. Therefore, the 24,203-point level is not only short-term support but also the watershed for whether the current weak rebound can continue.
In terms of bull and bear warrant capital distribution, there are 2,562 products in the market, with 1,439 bull warrants and 1,123 bear warrants, slightly favoring bulls in quantity. The most concentrated recovery price for bull warrants is between 24,000 and 24,499 points, close to recent lows, reflecting that bullish funds are mainly positioned near relatively stronger support areas. Bear warrant trading is most concentrated between 25,500 and 25,999 points, indicating that bearish funds are deployed near overhead resistance zones, clearly betting on a rebound failure. Street-level holdings show that the most concentrated bull warrant region is also between 24,000 and 24,499 points, while bear warrant street-level holdings are concentrated between 28,000 and 28,499 points. This suggests that the current market position structure shows some bias, with bull warrant positions heavily concentrated near lower levels, while bear warrant positions are placed at higher levels. Overall, the market isn’t completely one-sided in its bullish or bearish outlook, but rather forms a clear tug-of-war dynamic: bulls defend near lower supports, while bears guard against rebounds near resistance zones. However, looking solely at street-level distributions, there is indeed a more pronounced single-sided concentration, as bull warrant concentrations are higher, representing that much capital still expects the index to hold lower levels before bouncing back.
Regarding the two viewpoints mentioned by investors, first, bullish investors waiting for the index to rise back to 26,000 points and choosing bull warrants with a recovery price of 24,000 points is not entirely unreasonable in direction, as the 24,000-point recovery price is indeed close to where bull warrant trading and street-level holdings concentrate—where the market generally believes there’s some defensive strength near 24,200 points. However, note that the current index is only at 25,063 points, still nearly a thousand points away from 26,000 points, with significant resistance already present at 25,200, 25,500, and 25,700 points. Thus, 'eventually returning to 26,000 points' can be a rebound target but shouldn’t be assumed to happen soon. In terms of short-term value betting, the advantage of 24,000-point bull warrants is their relatively reasonable position, supported by market consensus; however, the disadvantage is that if 24,203 points fail again, risks will escalate quickly. Therefore, such deployment qualifies as conditional rebound speculation, not simply high-probability trend-following trades.
As for bearish investors who believe that after filling the gap, prices will fall tomorrow and want to bet on bear warrants, this perspective isn’t entirely without merit since the overall trend hasn't turned bullish yet, moving averages remain downward, and bear warrant trading concentrates between 25,500 and 25,999 points, showing that substantial funds are already waiting to go short. However, rushing into bear warrants at today's price of 25,063 might not offer particularly high value betting, as the index is not at a peak but has just bounced back from the 24,203-point low and remains in the middle-to-lower range, still some distance from major bear warrant concentration zones. This means while the bearish direction is understandable, deploying too early without waiting for a rebound closer to resistance zones like 25,200–25,500 points may result in suboptimal short-term space and risk-reward ratios.
Overall, Hang Seng Index remains in a weak rebound pattern in the short term. Aiming for 26,000 points isn’t impossible, but the index must first break through 25,239 points and then recover the 25,500–25,700 resistance zone. Conversely, if it falls below 24,700 and then 24,203 again, weakness will dominate once more. Bullish investors using 24,000-point bull warrants to bet on a rebound have a rationale, provided lower supports hold. For bearish investors wanting to immediately bet on bear warrants, the logic makes sense, but without waiting for a rebound closer to resistance levels, short-term value betting is only moderate. $BI-HSI @EP2606B.P (24183.HK)$$JP-HSI @EP2605A.P (22976.HK)$$BI#HSI RP28049.P (68742.HK)$$BI#HSI RP2804K.P (60641.HK)$
Pop Mart (09992.HK): Investors indicated sufficient volume today, can it surge to 220-230 yuan? Some investors are deploying put warrants with a strike price of 177.9 yuan at higher levels.
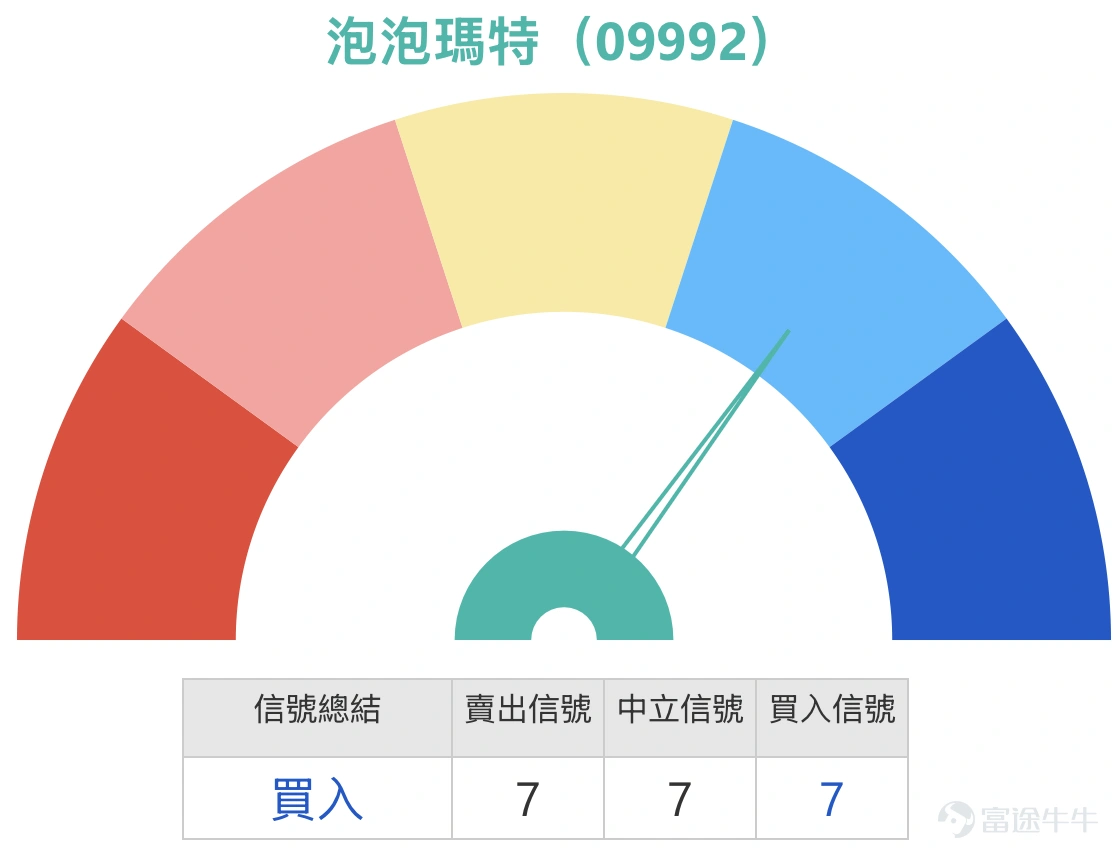
Pop Mart’s current price is 217.2 yuan, with a recent trading range between 174.3 and 274.2 yuan, resulting in a total fluctuation of approximately 57.3%, classifying it as a high-volatility stock. Focusing solely on the short term, the share price is currently at a sensitive upper-middle position. Immediate support below is around 204.2 yuan, near today’s low, followed by the psychological 200-yuan mark. Resistance above is initially seen at 219.4 yuan, near today’s high, with the next key area between 220 and 225 yuan. The 230-yuan level investors are eyeing represents a higher target and won’t automatically follow a breakout from current levels.
Technically, moving averages are currently intertwined, indicating no strong unidirectional trend. The relative strength index sits in neutral territory, showing neither significant overstrength nor weakening, leaving the stock in a transitional phase capable of moving either way. Bollinger Bands suggest prices are hovering around the midline, signaling consolidation awaiting a directional breakout rather than being in an aggressive breakout phase. Although today’s gains were notable, the technical structure doesn’t yet justify defining this as the start of a renewed strong upward trend.
For further upward movement, conditions are clear: the share price must first stabilize effectively above 219.4 yuan and genuinely hold above the psychological 220-yuan level. Only achieving this step would allow the market to push toward 225 yuan and possibly 230 yuan. If the price merely spikes near 220 yuan intraday without holding, or quickly retreats after touching 220 yuan, such movements should be viewed as range-bound bounces rather than breakouts. This means 220 yuan serves as the first trigger point; whether it stabilizes will directly determine if 230 yuan has a short-term chance of being tested.
Downside risks are equally evident. If the share price breaks back below 204.2 yuan, it signals that today’s uptrend couldn’t sustain, with insufficient short-term buying support. A further breach below 200 yuan would significantly worsen the short-term recovery rhythm, potentially leading the market back into consolidation or even a weaker pattern. Current entangled moving averages reflect weak directional cues, so any breakdown of critical support could lead to a rapid re-weakening of the share price.
In terms of warrant capital distribution, the market has a total of 171 products, including 107 call warrants and 64 put warrants, with more call warrants in terms of product quantity. The most concentrated strike price range for call warrant trading is between HKD 254 and HKD 254.99, while for put warrants it is concentrated between HKD 162 and HKD 162.99. This distribution reflects that while there are funds continuing to position for upward movement, the focus is mainly on larger extensions. On the other hand, bearish funds are concentrated in lower strike price areas, indicating defensive or medium-term profit-taking strategies. In terms of street inventory, call warrants are concentrated between HKD 220 and HKD 220.99, while put warrants are concentrated between HKD 231 and HKD 231.99, showing an overall one-sided concentration. This phenomenon is worth noting because the street inventory of call warrants is right around HKD 220, suggesting that this level is highly watched by the market. Meanwhile, the street inventory of put warrants is concentrated around HKD 231, meaning if the stock price moves closer to HKD 230, the market's caution over profit-taking will significantly increase. Overall, the market isn't completely bullish but presents a divergent pattern of 'short-term upside potential above HKD 220 while simultaneously having defensive bearish deployments at higher levels.'
Regarding investors mentioning today's large volume and whether it can push towards HKD 220-230, my view is that reaching HKD 220 is possible, but reaching HKD 230 requires further confirmation. The current price of HKD 217.2 is already very close to HKD 220, and today's increased trading volume indeed raises the possibility of testing HKD 220 in the short term, which is a reasonable judgment. However, HKD 220 and HKD 230 are not the same thing; HKD 220 is just the immediate resistance level, while reaching HKD 230 would require the market to first stabilize above HKD 220 and then have continued buying pressure to gradually reach that level. Therefore, viewing HKD 220 and HKD 230 together as a single short-term target is somewhat optimistic.
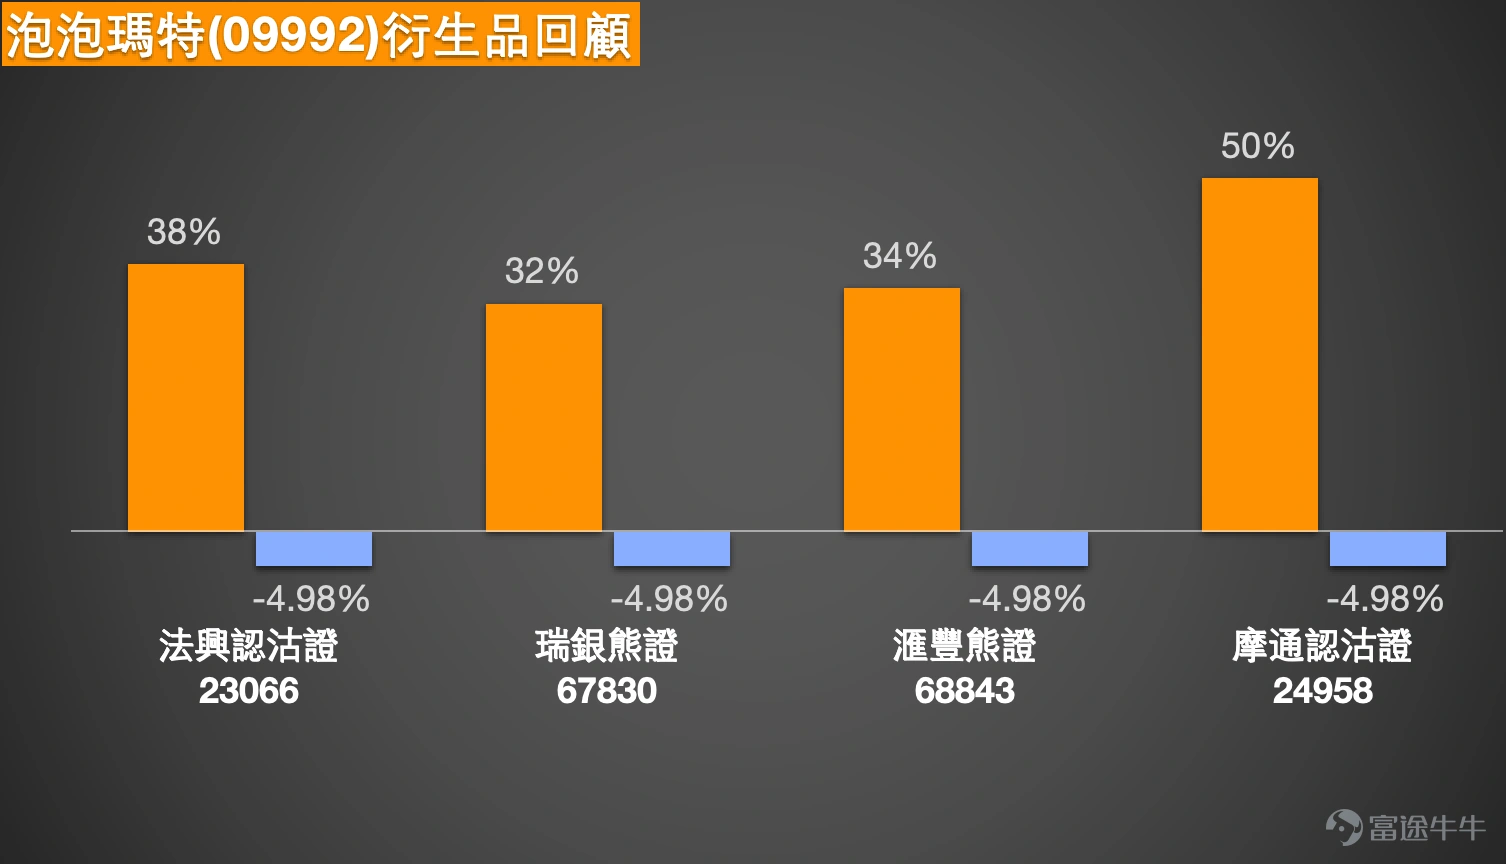
As for investors deploying put warrants at higher levels with a strike price of HKD 177.9, the direction is not entirely unreasonable because the stock price has rebounded quite a bit in the short term, and there is inherent resistance near HKD 220. Deploying defensively bearish positions at higher levels is understandable. However, in terms of short-term trading value, HKD 177.9 is considered a distant strike price, with considerable distance between the current price and the strike price. Such products are more suitable for betting on deeper pullbacks rather than simply expecting a brief fallback near HKD 220. In simple terms, the idea of being bearish on high-level resistance is understandable, but using distant strike price put warrants like HKD 177.9 for short-term deployment offers only average betting value. This is because you're not only betting on the correct direction but also gambling on significant and rapid declines for the product to react favorably.
Overall, Pop Mart is currently in a consolidating and pending change pattern. Today's surge in volume does make it possible for HKD 220 to be challenged, but moving further to HKD 230 requires first stabilizing in the HKD 219.4 to HKD 220 region. The bullish perspective is relatively reasonable in the short term, but targets shouldn't be set too far ahead. Deploying put warrants at higher levels isn’t entirely wrong for the bearish side, but using distant strike price products like HKD 177.9 for short-term trading doesn't offer particularly attractive short-term value. $SGPOMRT@EP2606A.P (23066.HK)$$UB#POMRTRP2812K.P (67830.HK)$$HS#POMRTRP2812C.P (68843.HK)$$JPPOMRT@EP2605B.P (24958.HK)$
AIA (01299.HK): Is it a rebound from the bottom? In the warrant market, investors are looking at HKD 90-95, holding bull contracts with a stop-loss at HKD 76.
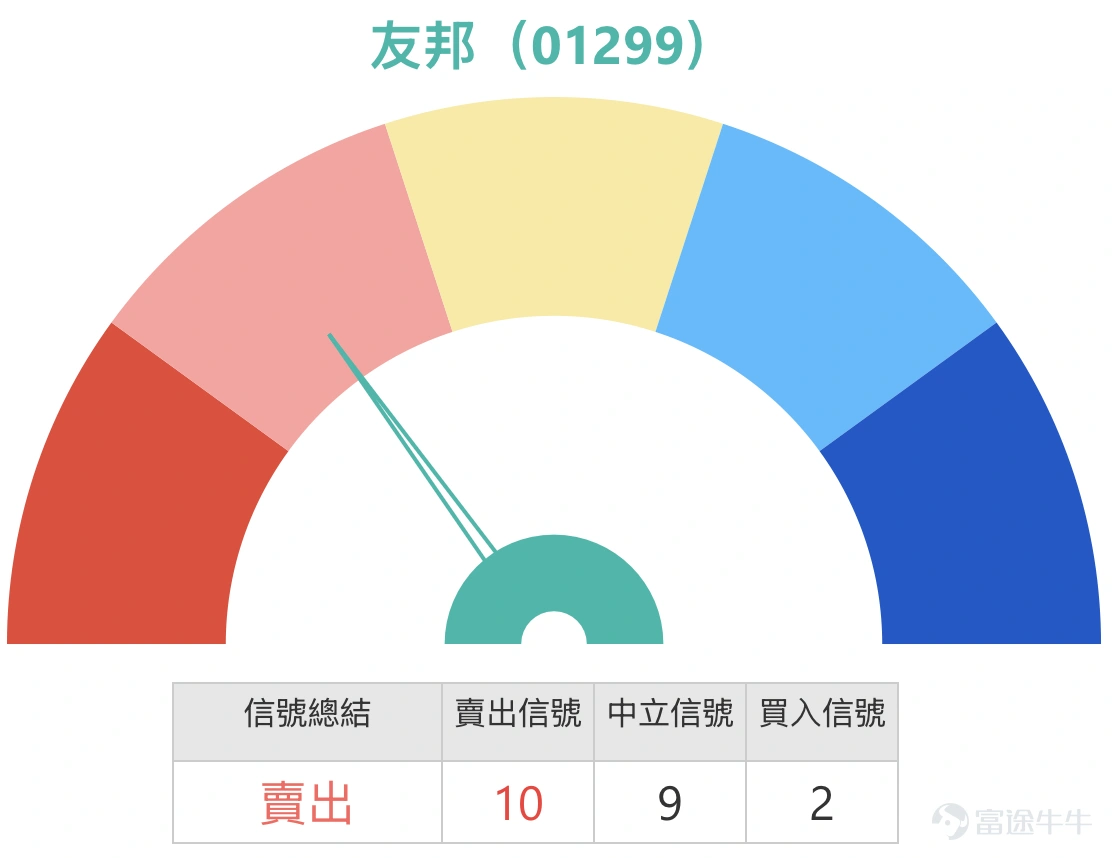
AIA is currently priced at HKD 85.1, with a recent clear trading range between HKD 78.7 and HKD 92.1, representing a volatility of approximately 17.0%. From a short-term perspective, the stock price is currently in the upper-middle part of this range, not close to the lowest point, but it hasn't truly broken through the upper resistance either. The nearest support below is around HKD 82 to HKD 83, as this area has been a repeatedly contested zone recently, followed by HKD 78.7 as the obvious recent low. Above, resistance is first seen near HKD 85.3 to HKD 86.2, close to the day’s high and short-term dense area, and then around HKD 88, before reaching HKD 92.1, the recent high.
Technically, moving averages are still entangled, reflecting that the trend hasn't formed a clear one-sided direction. The relative strength index is neutral and stable, showing no particular strength but not weak either. Regarding Bollinger Bands, the stock price is running close to the middle band, indicating that the current movement is more like a rebound within a consolidation range rather than entering a strong breakout phase. This technical structure typically represents the market attempting to repair, but it hasn't reached the point where a new upward trend can be confirmed.
For further upward movement, the condition is clear: the stock price must first stabilize above the short-term resistance zone of HKD 85.3 to HKD 86.2, then break through HKD 88, giving the market a reason to look towards HKD 90-95. In other words, prices above HKD 90 won’t naturally extend from the current price unless the nearby resistance zone is first overcome, and only then will the short-term uptrend truly open up. If the price merely approaches around HKD 86 and retreats again, the overall movement will still be a rebound within the range and insufficient to confirm a strong upward attack.
The downside risk is equally clear. If the stock price falls back below the HKD 82 to HKD 83 region, it indicates insufficient support for this rebound, and the short-term recovery rhythm will be disrupted. If it further breaks below HKD 78.7, it means the market hasn’t truly bottomed out and will revert to a search-for-bottom pattern. As the moving averages are still tangled, directional clarity isn’t strong, so once support is lost, the stock price might weaken relatively quickly.
In terms of warrant capital distribution, the market has a total of 84 products, including 56 call warrants and 28 put warrants, clearly showing more call warrants in terms of product quantity. The most concentrated strike price for call warrant trading is between HKD 91 and HKD 91.99, while for put warrants it is concentrated between HKD 69 and HKD 69.99. This suggests that the mainstream market strategy is to deploy for an upward price recovery with the main target being the area above HKD 90. Bearish funds are concentrated in lower strike prices, reflecting a more defensive or deeper pullback mindset. Regarding street inventory, the most concentrated area for call warrants is also between HKD 91 and HKD 91.99, while for put warrants it is between HKD 66 and HKD 66.99, showing overall one-sided concentration. This reflects that the market's positioning leans more towards waiting for AIA to recover upwards rather than unanimously bearish.
As for investors asking whether this is a rebound from the bottom and whether looking at the range of 90 to 95 with a bull certificate at a stop-loss price of 76 is reasonable, I would say directly: currently, there are only conditions for a rebound, but it cannot be fully confirmed that the bottom has been reached. The reason is that the stock price has indeed rebounded from the low of 78.7, and the current price has returned above 85, indicating support at the lows, so the rebound is not baseless. However, since the moving averages are still entangled and the Bollinger Bands are just approaching the midline, the structure is still closer to a range repair rather than a very clear trend reversal. Therefore, the notion of 'rebound from the bottom' can be accepted, but with the premise that the stock price must further recover the 86 to 88 region to truly confirm.
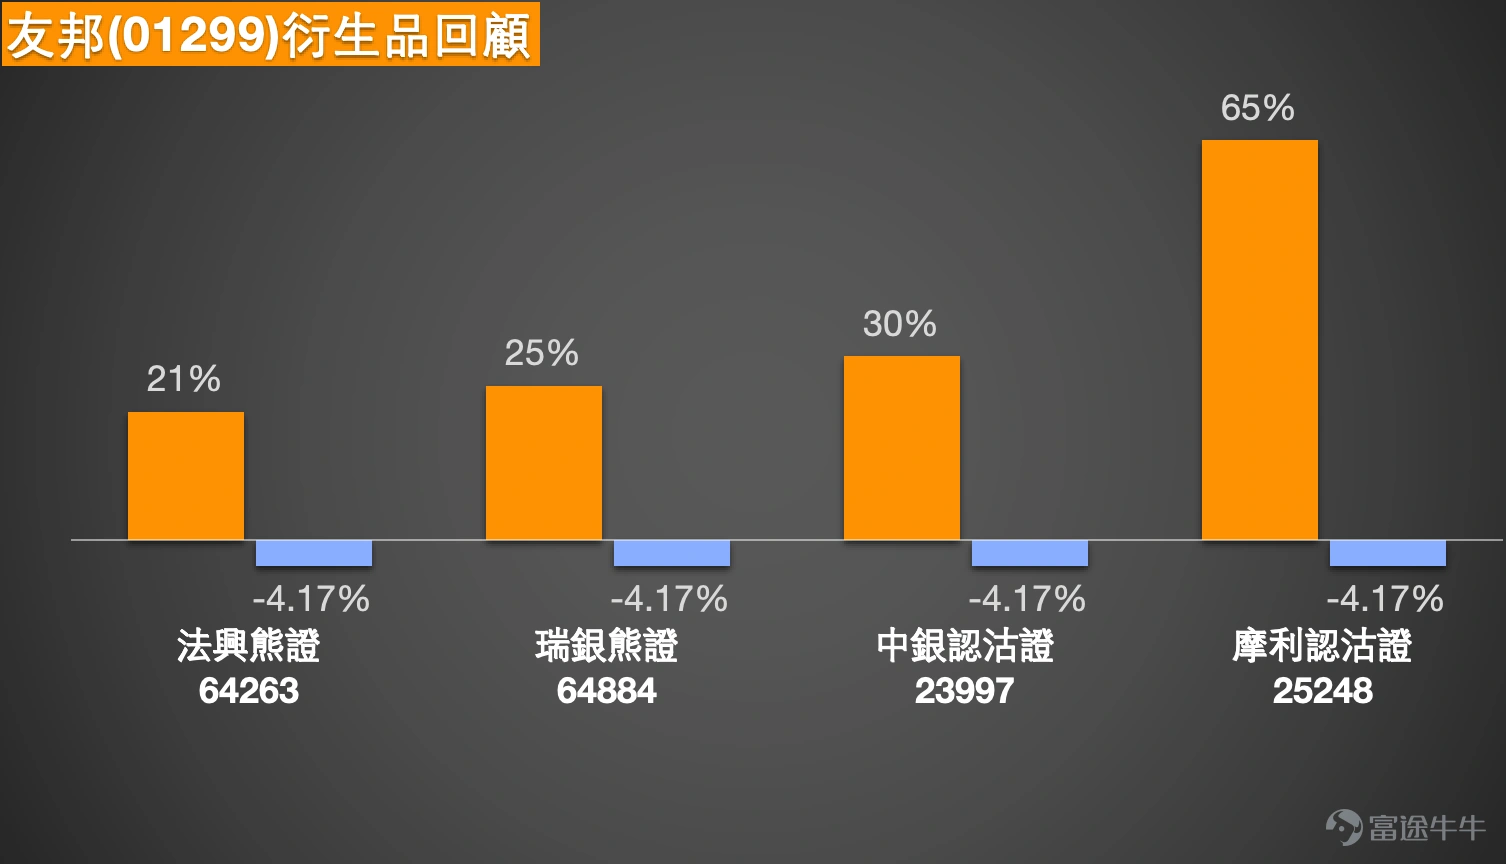
As for targeting the range of 90 to 95, short-term aiming for 90 is conditional because market turnover and street inventory concentrate around 91, indicating that much capital is already positioned in this direction; however, 95 is relatively aggressive as it is higher than the recent high of 92.1, reaching this level requires not only breaking through short-term resistance but also extending the upward trend, so it should not be considered an inevitable short-term target. Regarding holding a bull certificate with a stop-loss price of 76, from a risk control perspective, this stop-loss price is below the recent low of 78.7, providing reasonable buffer space—not overly tight—and represents a relatively defensive deployment. In simple terms, the direction is reasonable, and the stop-loss price setting is not too aggressive, offering a moderate-to-high short-term reward-to-risk ratio. However, the prerequisite remains that the stock price must hold above 82 to 83 and gradually reclaim 86 to 88; otherwise, even if the direction may not ultimately be wrong, the short-term trend could still be volatile and time-consuming. $SG#AIA RP2812E.P (64263.HK)$$UB#AIA RP2812A.P (64884.HK)$$BI-AIA @EP2607B.P (23997.HK)$$MS-AIA @EP2606A.P (25248.HK)$
Reminder: This article does not constitute any investment advice.
This article is for reference only and does not constitute any investment advice. The market data, opinions, and analysis contained herein may change at any time without prior notice. We are not responsible for any loss or damage caused by reliance on the information in this article. Technical analysis only shows whether certain technical conditions are met; a comprehensive assessment of asset performance should combine other data and should not solely rely on this article to make trading decisions. Please note that past performance is not indicative of future results. Follow Jenny's insights on Hong Kong stock warrants for more professional analysis.
Risk Disclaimer: The above content only represents the author's view. It does not represent any position or investment advice of Futu. Futu makes no representation or warranty.Read more

Comment (1)
to post a comment
5
12