
English
Back
Open Account
港股窩輪Jenny
wrote a column · Mar 24 14:25

BYD's stock price is approaching its yearly high. Is there sufficient upward momentum in the short term?

$BYD COMPANY (01211.HK)$ The recent trend shows a steady upward climb. Today, the stock price rebounded from a low of 100.9 yuan, reaching an intraday high of 107 yuan, nearing the yearly high of 108 yuan set on March 1st, and currently trading at 105.3 yuan. The stock price has successfully broken through the 10-day moving average (101.69 yuan) and is firmly above the 30-day moving average (98.27 yuan) and the 60-day moving average (97.49 yuan). Short-, medium-, and long-term moving averages are gradually forming a bullish alignment, with support underneath significantly strengthening, indicating a clear signal of an improving trend.
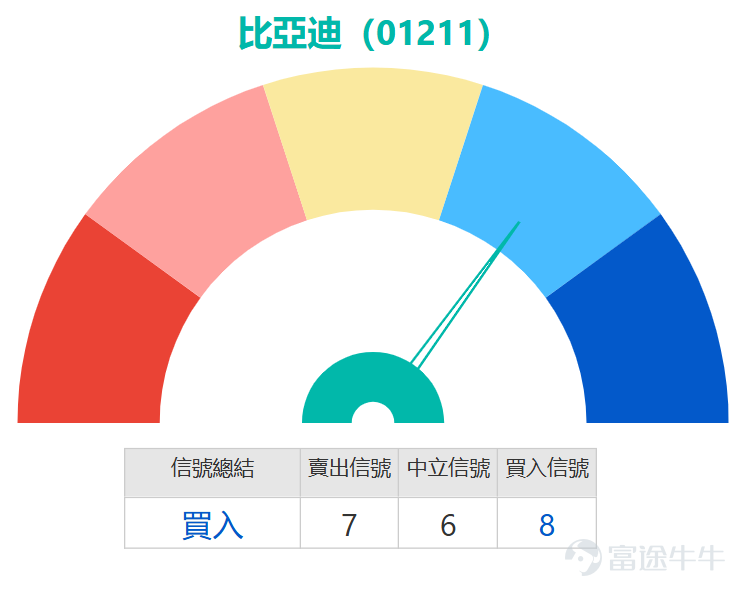
On the technical indicator front, multiple positive resonances are observed: both the Stochastic Oscillator and CCI indicators have issued clear buy signals, showing that price momentum is continuously increasing; the RSI indicator currently stands at 58, within a neutral to strong range, not yet in overbought territory, implying ample room for further upside; key trend indicators such as Momentum Oscillator, Bull-Bear Power Indicator, and MACD all point to a buy, where MACD's golden cross often heralds the start of a phase trend movement; additionally, tools like Ichimoku Cloud and Bollinger Bands also support the judgment that the stock will continue to perform strongly. Overall, technical indicators conclude with a 'Buy' rating, with signal strength reaching 8.
In terms of key price levels, the immediate short-term resistance is at 107.4 yuan. A successful break could lead to testing the second resistance level at 114.3 yuan. Support levels are also rising; the first support is near 98 yuan (basically coinciding with the 30-day moving average), and the second support is at 92.5 yuan, forming two solid defensive lines. The current stock price is in the upper-middle region between support and resistance, with a technical structure clearly favorable for bulls to test resistance levels.
$BYD COMPANY (01211.HK)$ The recent trend shows a steady upward climb. Today, the stock price rebounded from a low of 100.9 yuan, reaching an intraday high of 107 yuan, nearing the yearly high of 108 yuan set on March 1st, and currently trading at 105.3 yuan. The stock price has successfully broken through the 10-day moving average (101.69 yuan) and is firmly above the 30-day moving average (98.27 yuan) and the 60-day moving average (97.49 yuan). Short-, medium-, and long-term moving averages are gradually forming a bullish alignment, with support underneath significantly strengthening, indicating a clear signal of an improving trend. On the technical indicator front, multiple positive resonances are observed: both the Stochastic Oscillator and CCI indicators have issued clear buy signals, showing that price momentum is continuously increasing; the RSI indicator currently stands at 58, within a neutral to strong range, not yet in overbought territory, implying ample room for further upside; key trend indicators such as Momentum Oscillator, Bull-Bear Power Indicator, and MACD all point to a buy, where MACD's golden cross often heralds the start of a phase trend movement; additionally, tools like Ichimoku Cloud and Bollinger Bands also support the judgment that the stock will continue to perform strongly. Overall, technical indicators conclude with a 'Buy' rating, with signal strength reaching 8. In terms of key price levels, the immediate short-term resistance is at 107.4 yuan. A successful break could lead to testing the second resistance level at 114.3 yuan. Support levels are also rising; the first support is near 98 yuan (basically coinciding with the 30-day moving average), and the second support is at 92.5 yuan, forming two solid defensive lines. The current stock price is in the upper-middle region between support and resistance, with a technical structure clearly favorable for bulls to test resistance levels.
UBS Group recently released an investment report on the Chinese market, screening out Chinese stocks expected to outperform in the rising oil price cycle. The following Hong Kong-listed stocks received ratings as follows: $CHINA MOBILE (00941.HK)$ apart from giving a 'Neutral' rating, all other stocks maintain a 'Buy' rating, including $PETROCHINA (00857.HK)$$CNOOC (00883.HK)$$DONGFANG ELEC (01072.HK)$ , BYD shares, $CITIC BANK (00998.HK)$$CCB (00939.HK)$$BANK OF CHINA (03988.HK)$$ICBC (01398.HK)$$Li Auto (LI.US)$ As U.S. stock targets were also included in the portfolio with a 'Buy' rating.
Looking back at March 18, in the following two trading days, the corresponding BYD stock price cumulatively increased by 1.57%, and related bullish derivatives all recorded positive returns: among them, $UB#BYD RC2607X.C (57321.HK)$$BI#BYD RC2612D.C (55018.HK)$ both rose by 8% during the period, $HS-BYD @EC2608A.C (25528.HK)$ with an increase of 7%, $UB-BYD @EC2608A.C (25678.HK)$ a rise of 10%. The movement of these products closely matched the upward trend of the underlying stock, reflecting the profit elasticity characteristic of leveraged derivatives that fluctuate with the stock.
$BYD COMPANY (01211.HK)$ The recent trend shows a steady upward climb. Today, the stock price rebounded from a low of 100.9 yuan, reaching an intraday high of 107 yuan, nearing the yearly high of 108 yuan set on March 1st, and currently trading at 105.3 yuan. The stock price has successfully broken through the 10-day moving average (101.69 yuan) and is firmly above the 30-day moving average (98.27 yuan) and the 60-day moving average (97.49 yuan). Short-, medium-, and long-term moving averages are gradually forming a bullish alignment, with support underneath significantly strengthening, indicating a clear signal of an improving trend. On the technical indicator front, multiple positive resonances are observed: both the Stochastic Oscillator and CCI indicators have issued clear buy signals, showing that price momentum is continuously increasing; the RSI indicator currently stands at 58, within a neutral to strong range, not yet in overbought territory, implying ample room for further upside; key trend indicators such as Momentum Oscillator, Bull-Bear Power Indicator, and MACD all point to a buy, where MACD's golden cross often heralds the start of a phase trend movement; additionally, tools like Ichimoku Cloud and Bollinger Bands also support the judgment that the stock will continue to perform strongly. Overall, technical indicators conclude with a 'Buy' rating, with signal strength reaching 8. In terms of key price levels, the immediate short-term resistance is at 107.4 yuan. A successful break could lead to testing the second resistance level at 114.3 yuan. Support levels are also rising; the first support is near 98 yuan (basically coinciding with the 30-day moving average), and the second support is at 92.5 yuan, forming two solid defensive lines. The current stock price is in the upper-middle region between support and resistance, with a technical structure clearly favorable for bulls to test resistance levels.
For investors who are optimistic about the future market and seeking leverage effects, call warrants can be considered. $BI-BYD @EC2606A.C (22525.HK)$ The exercise price is 116.98 yuan, characterized by the lowest premium and implied volatility among similar products, making it suitable for investors who are bullish on the underlying stock and wish to control costs. Another option is $UB-BYD @EC2606A.C (22495.HK)$ with the same exercise price of 116.98 yuan. Its implied volatility is relatively lower, which helps reduce the impact of time decay. For those pursuing higher leverage effects, bull contracts can be considered, among which $BI#BYD RC2612D.C (55018.HK)$ the recovery price is 85 yuan, with the highest actual leverage among similar products and a lower premium, reacting more sensitively to fluctuations in the underlying stock; $UB#BYD RC2607X.C (57321.HK)$The recovery price is HK$85.5, also featuring high actual leverage and low premium, making it suitable for an aggressive bullish strategy.
For bearish options, put warrants can be considered.$CT-BYD @EP2611A.P (27250.HK)$With a strike price of HK$84.95, it has the lowest premium and implied volatility, which helps reduce entry costs in a bearish market outlook.$UB-BYD @EP2611A.P (24648.HK)$Also with a strike price of HK$84.95, this product stands out for its ideal leverage and implied volatility, providing an efficient hedging or shorting tool. For those preferring to directly track stock price declines, there are bear certificates such as$JP#BYD RP2808C.P (61928.HK)$With a recovery price of HK$115, it has the lowest premium among similar products and relatively high actual leverage.$UB#BYD RP2808C.P (56846.HK)$With a recovery price of HK$113, it combines high actual leverage with low premium, making it suitable for short-term deployment when anticipating resistance-led pullbacks in stock prices.
$BYD COMPANY (01211.HK)$ The recent trend shows a steady upward climb. Today, the stock price rebounded from a low of 100.9 yuan, reaching an intraday high of 107 yuan, nearing the yearly high of 108 yuan set on March 1st, and currently trading at 105.3 yuan. The stock price has successfully broken through the 10-day moving average (101.69 yuan) and is firmly above the 30-day moving average (98.27 yuan) and the 60-day moving average (97.49 yuan). Short-, medium-, and long-term moving averages are gradually forming a bullish alignment, with support underneath significantly strengthening, indicating a clear signal of an improving trend. On the technical indicator front, multiple positive resonances are observed: both the Stochastic Oscillator and CCI indicators have issued clear buy signals, showing that price momentum is continuously increasing; the RSI indicator currently stands at 58, within a neutral to strong range, not yet in overbought territory, implying ample room for further upside; key trend indicators such as Momentum Oscillator, Bull-Bear Power Indicator, and MACD all point to a buy, where MACD's golden cross often heralds the start of a phase trend movement; additionally, tools like Ichimoku Cloud and Bollinger Bands also support the judgment that the stock will continue to perform strongly. Overall, technical indicators conclude with a 'Buy' rating, with signal strength reaching 8. In terms of key price levels, the immediate short-term resistance is at 107.4 yuan. A successful break could lead to testing the second resistance level at 114.3 yuan. Support levels are also rising; the first support is near 98 yuan (basically coinciding with the 30-day moving average), and the second support is at 92.5 yuan, forming two solid defensive lines. The current stock price is in the upper-middle region between support and resistance, with a technical structure clearly favorable for bulls to test resistance levels.
Do you think BYD can successfully break through its yearly high of HK$108 to open up new upside potential? UBS Group has listed BYD as a beneficiary of the oil price increase cycle. Do you think the movement of oil prices will be a key factor influencing BYD's subsequent stock price? Feel free to share your insights in the comments section. For more market analysis, stay tuned to 'Hong Kong Warrant Jenny' for daily updates!
Reminder: This article does not constitute any investment advice.
This article is for reference only and does not constitute any investment advice. The market data, opinions, and analysis contained herein may change at any time without prior notice. We are not responsible for any loss or damage caused by reliance on the information in this article. Technical analysis only shows whether certain technical conditions are met; a comprehensive assessment of asset performance should be conducted using additional data. Decisions to trade should not be based solely on this article. Please note that past performance is not indicative of future results.
#HongKongStocks #RealTimeAnalysis #WarrantsSelection #WarrantsStrategy #DerivativesHedging #HongKongWarrantsJenny #BYD #01211 #AutomobileStocks$Hang Seng Index (800000.HK)$$Hang Seng TECH Index (800700.HK)$
Risk Disclaimer: The above content only represents the author's view. It does not represent any position or investment advice of Futu. Futu makes no representation or warranty.Read more
Thumbs Up
1
Heart
1
433K Views
Report
Comments (3)
Write a Comment...
3
2
2