
Technical Analysis of Huahong Semiconductor: Breakthrough at 90.7 yuan is Key
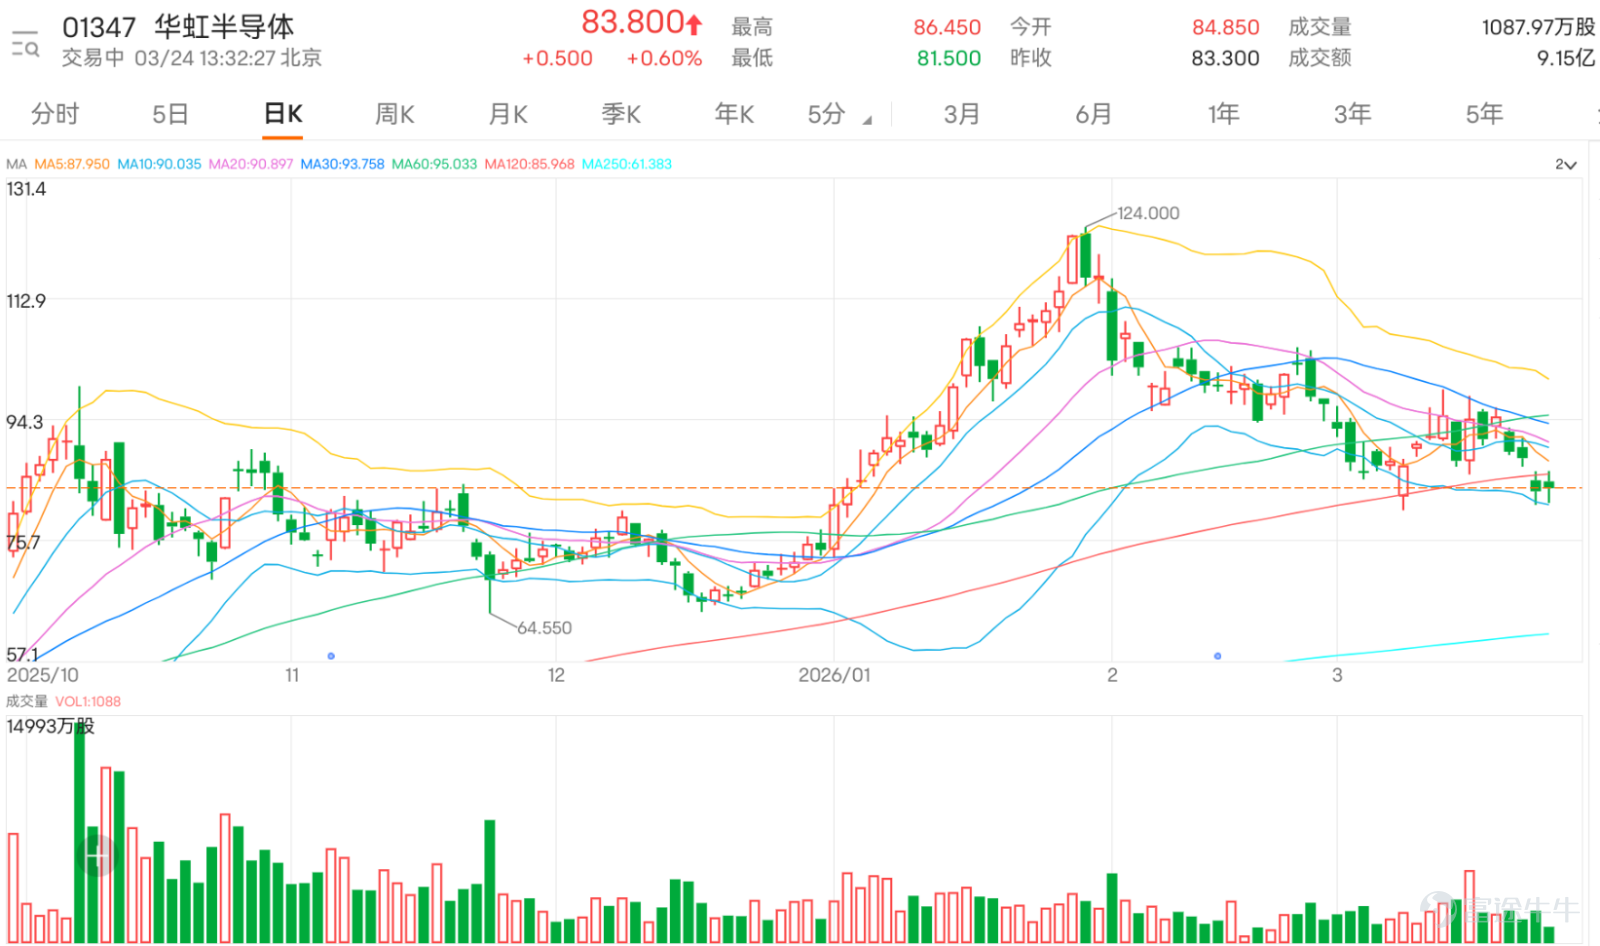
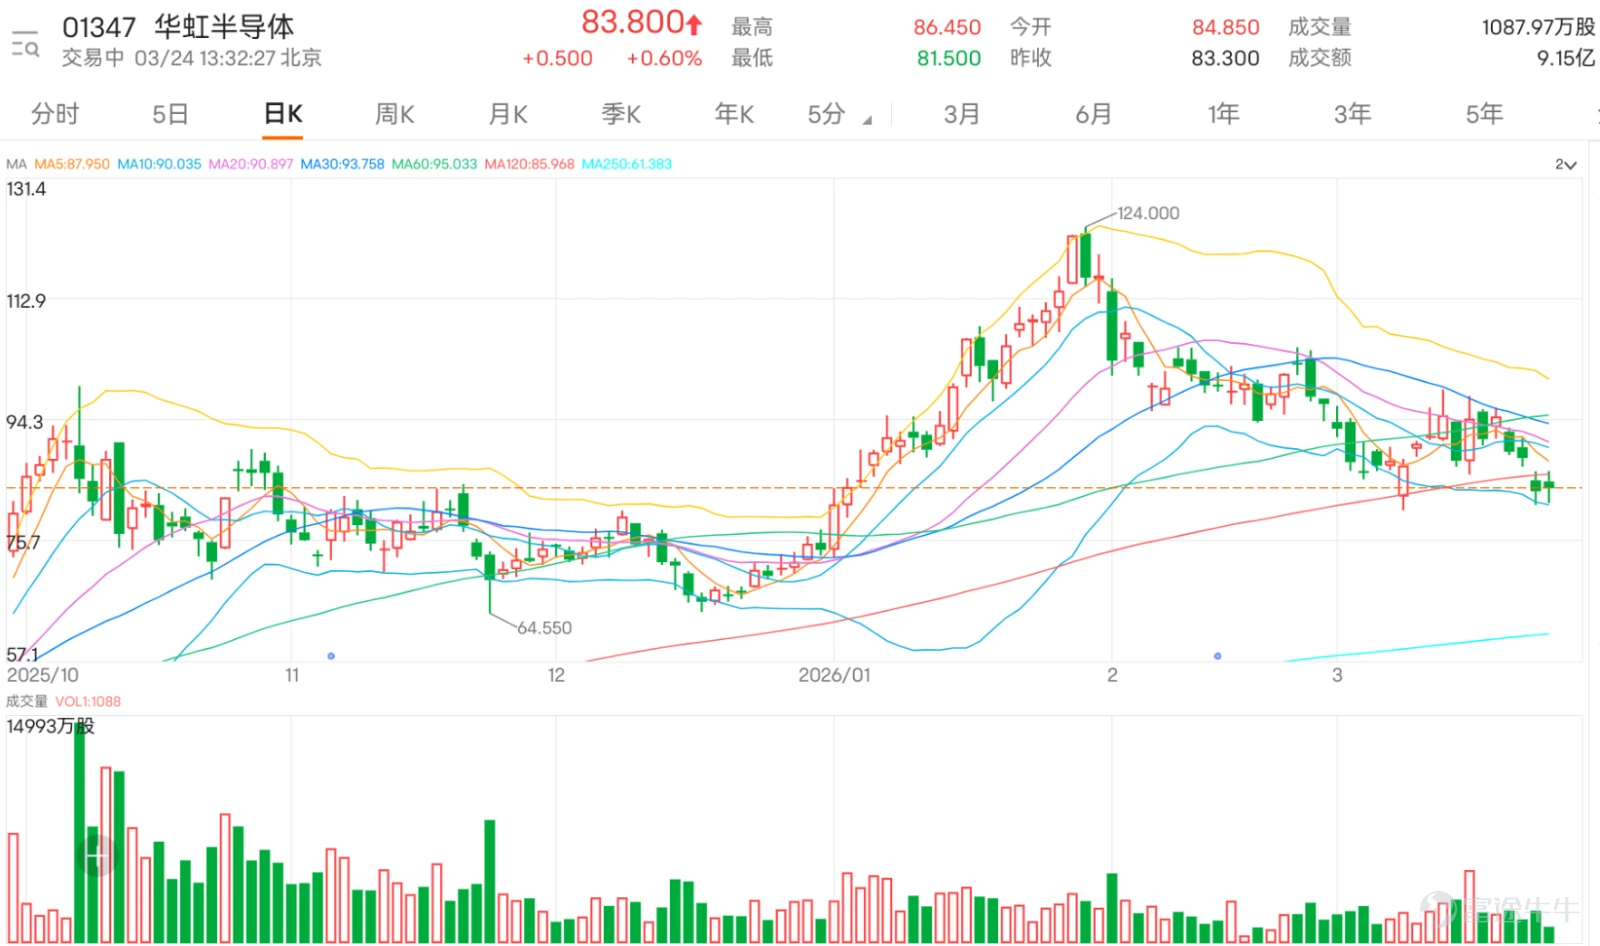
$HUA HONG GRACE (01347.HK)$The stock price has been under continuous pressure recently, entering a clear downward channel. As of the time of writing, the latest share price was 82.8 yuan, up 0.6%. From a medium-term trend perspective, the stock price has consecutively broken below the 10-day moving average (89.92 yuan), the 30-day moving average (93.72 yuan), and the 60-day moving average (95.01 yuan). The short, medium, and long-term moving averages have formed a bearish alignment, confirming a medium-term downtrend. Any subsequent rebound will first face intense pressure from the moving average system. However, after earlier sustained adjustments, the stock price has entered a technically oversold zone, with several contrarian indicators starting to emerge, drawing market attention to the possibility of a short-term technical rebound.
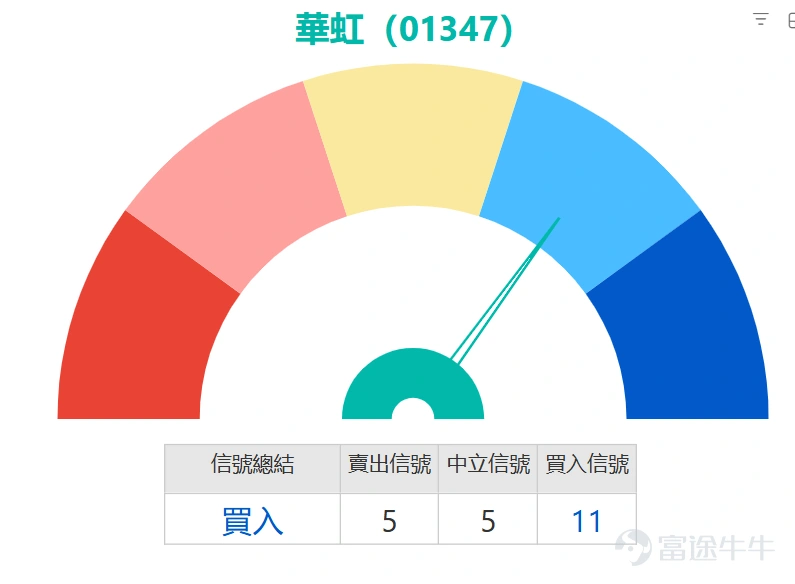
At the technical indicator level, there is a typical 'Trend and Momentum Divergence' characteristic: Trend indicators are predominantly bearish, with MACD, ADX, and Ichimoku Cloud all issuing sell signals, corroborating the bearish alignment of the moving averages, indicating that the medium-term bearish trend has not fundamentally reversed. However, at the same time, multiple momentum indicators are showing signs of excessive selling pressure release: Stochastic Oscillator and Williams %R have both entered the oversold zone, indicating that short-term downward momentum is nearing exhaustion; more notably, the CCI indicator is showing a clear 'Bottom Divergence' signal, where the stock price remains low but the downward momentum continues to weaken, often an important precursor to a potential reversal. The current RSI reading is 39, which, though not in the extremely oversold zone, is already below the neutral level, similarly pointing to short-term technical recovery potential.
In terms of key price levels, the current stock price is trading within the range of the first support level at 78.6 yuan and the first resistance level at 90.7 yuan; the second support level below at 71.2 yuan serves as an important mid-term defense line, and a break below it could open up further downside space; the first resistance level above at 90.7 yuan is close to the 10-day moving average, acting as the primary pressure point for a short-term rebound. If it can effectively break through, it is expected to challenge the second resistance level at 99.6 yuan, which coincides with the 60-day moving average, and is expected to see more concentrated selling pressure.
In summary, Huahong Semiconductor's current trend shows characteristics of a 'Bearish Mid-Term Trend with Oversold Short-Term Potential for Rebound.' The current price-performance ratio does not justify trend-following short positions; after the emergence of oversold and bottom divergence signals, the risk-reward balance between short-term downside risk and potential rebound is gradually shifting, though this is not yet a buy signal for a trend reversal. A more reasonable strategy would be to consider it as a short-term rebound observation window. If the stock subsequently breaks through and stabilizes above the 90.7 yuan resistance level on strong volume, a short-term rebound can be confirmed, with a target of 99.6 yuan. Before such a breakout occurs, the stock is likely to remain in a range-bound movement between 78.6 yuan and 90.7 yuan. It is recommended to set 78.6 yuan and 71.2 yuan as key stop-loss references and closely monitor volume dynamics during the rebound to assess capital inflow intentions.
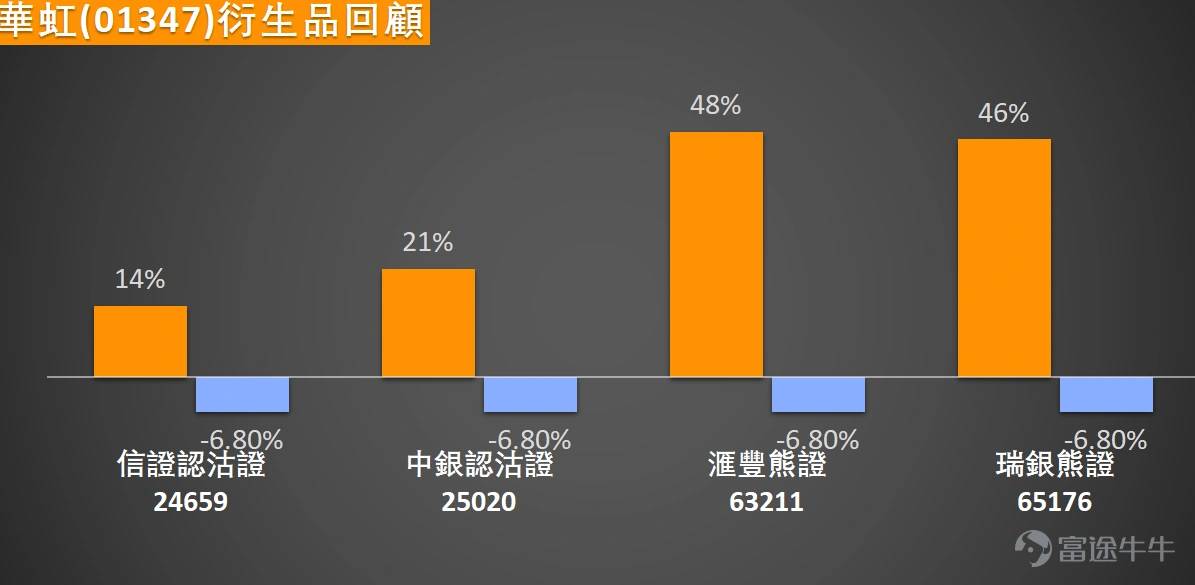
Looking back at March 18, over the next two trading days, Huahong Semiconductor's underlying stock cumulatively fell by 6.80%, while corresponding bearish derivatives all recorded significant increases:$HS#HUAHORP2812A.P (63211.HK)$ 、 $UB#HUAHORP2812J.P (65176.HK)$ During the period, they rose by 48% and 46%, respectively. The BOC put warrants (25020) and CCB put warrants (24659) gained 21% and 14%, respectively. The movement of these products is highly aligned with the downward trend of the underlying stocks, fully demonstrating the price elasticity characteristic of inverse leverage derivatives.
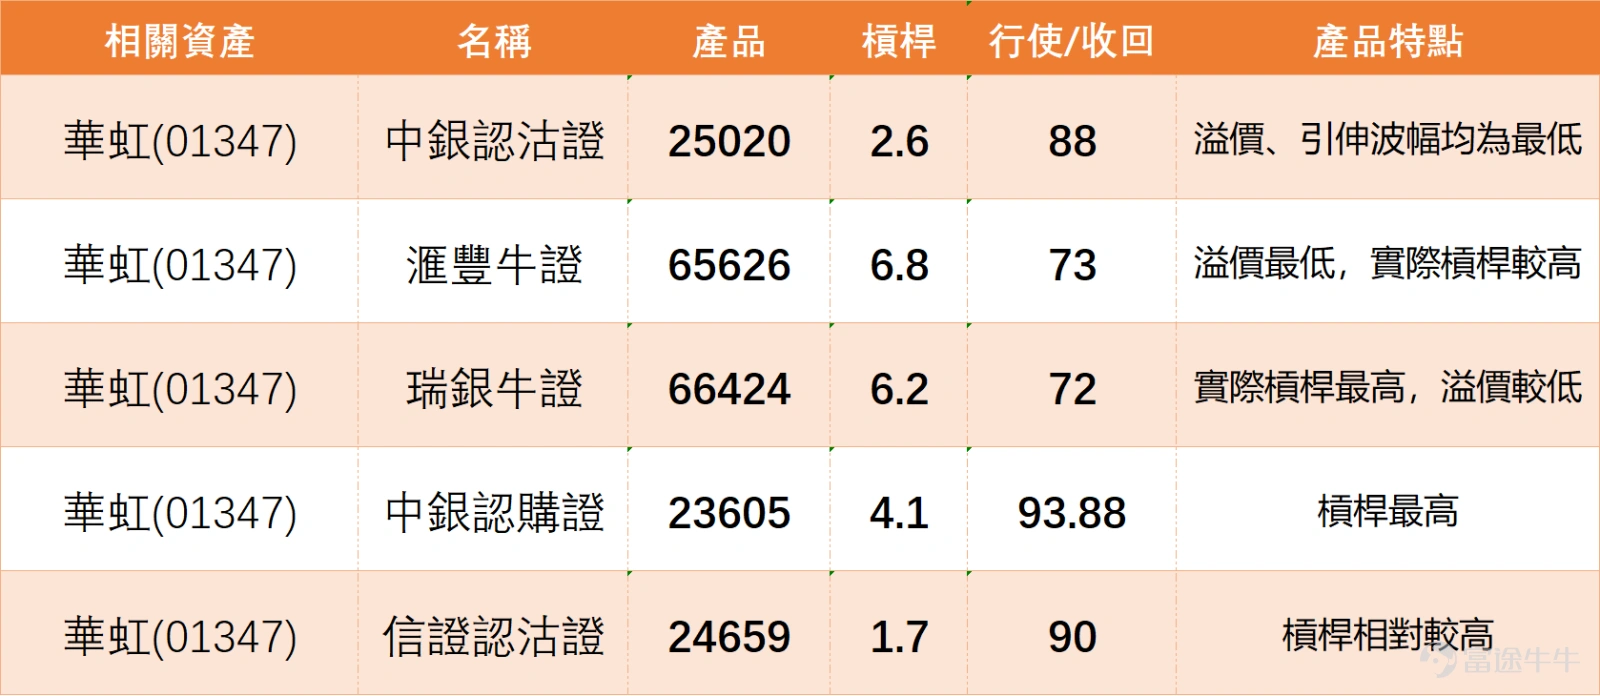
For the current market conditions where the underlying Hua Hong Semiconductor is at the edge of being technically oversold and may be poised for a rebound, investors can make short-term deployments through related derivative products. If optimistic about its technical rebound, they can focus on the product with the highest leverage, $BIHUAHO@EC2607A.C (23605.HK)$ with an exercise price of 93.88 yuan, which effectively amplifies potential rebound gains; if hoping to capture the rebound with lower premium costs, one might consider a relatively high-leverage $CIHUAHO@EP2611A.P (24659.HK)$ as a hedging or bearish tool, with an exercise price of 90 yuan.
If predicting that the stock price will form a bottom at a low level and rebound, bull certificate products offer more direct leverage effects. Among them, $UB#HUAHORC2607O.C (66424.HK)$ has the highest actual leverage, with a recovery price of 72 yuan and relatively low premium, making it suitable for aggressive investors seeking a rebound; while $HS#HUAHORC2608E.C (65626.HK)$ has a recovery price of 73 yuan, with the lowest premium in its category, offering relatively better defense. Conversely, if expecting the stock price to fail in rebounding and subsequently decline again, one can focus on $BIHUAHO@EP2607C.P (25020.HK)$ with an exercise price of 88 yuan, having the lowest premium and implied volatility, making the cost of bearish deployment relatively attractive.
Chip semiconductor stocks showed divergent performances, $BIREN TECH (06082.HK)$ 、 $NOVOSENSE (02676.HK)$ rebounding by 2%, $ASMPT (00522.HK)$ Up nearly 1%, $SMIC (00981.HK)$ 、 $SHANGHAI FUDAN (01385.HK)$ while the performance has been relatively weak. Do you think Huahong Semiconductor's recent adjustment has bottomed out? Will it first break below the support level of 78.6 yuan, or first surpass the resistance level at 90.7 yuan? Feel free to share your insights in the comment section. For more market analysis, stay tuned to 'HK Stock Warrants Jenny' for daily updates!
Reminder: This article does not constitute any investment advice.
This article is for reference only and does not constitute any investment advice. The market data, opinions, and analysis contained herein may change at any time without prior notice. We are not responsible for any loss or damage caused by reliance on the information in this article. Technical analysis only shows whether certain technical conditions are met; a comprehensive assessment of asset performance should be conducted using additional data. Decisions to trade should not be based solely on this article. Please note that past performance is not indicative of future results.
#Hong Kong Stocks #Real-time Analysis #Warrants Selection #Warrants Strategy #Derivatives Hedging #Hong Kong Stocks Warrants Jenny#Hua Hong Semiconductor#01347#Chip Semiconductor Stocks #Technical Analysis $Hang Seng TECH Index (800700.HK)$$Hang Seng Index (800000.HK)$
Risk Disclaimer: The above content only represents the author's view. It does not represent any position or investment advice of Futu. Futu makes no representation or warranty.Read more

Comments
to post a comment
1