

March 23rd [HK Stocks Podcast] Part 1 - Hang Seng Index, CGN Power, Leapmotor,
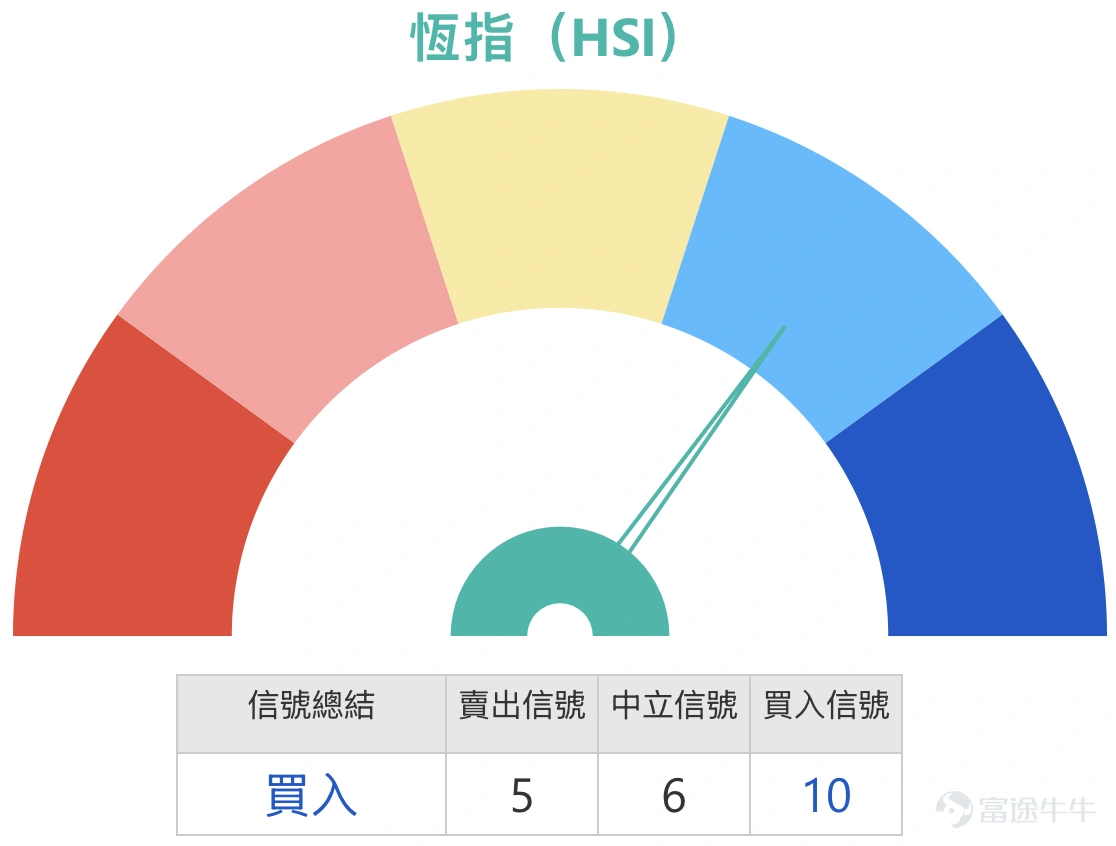
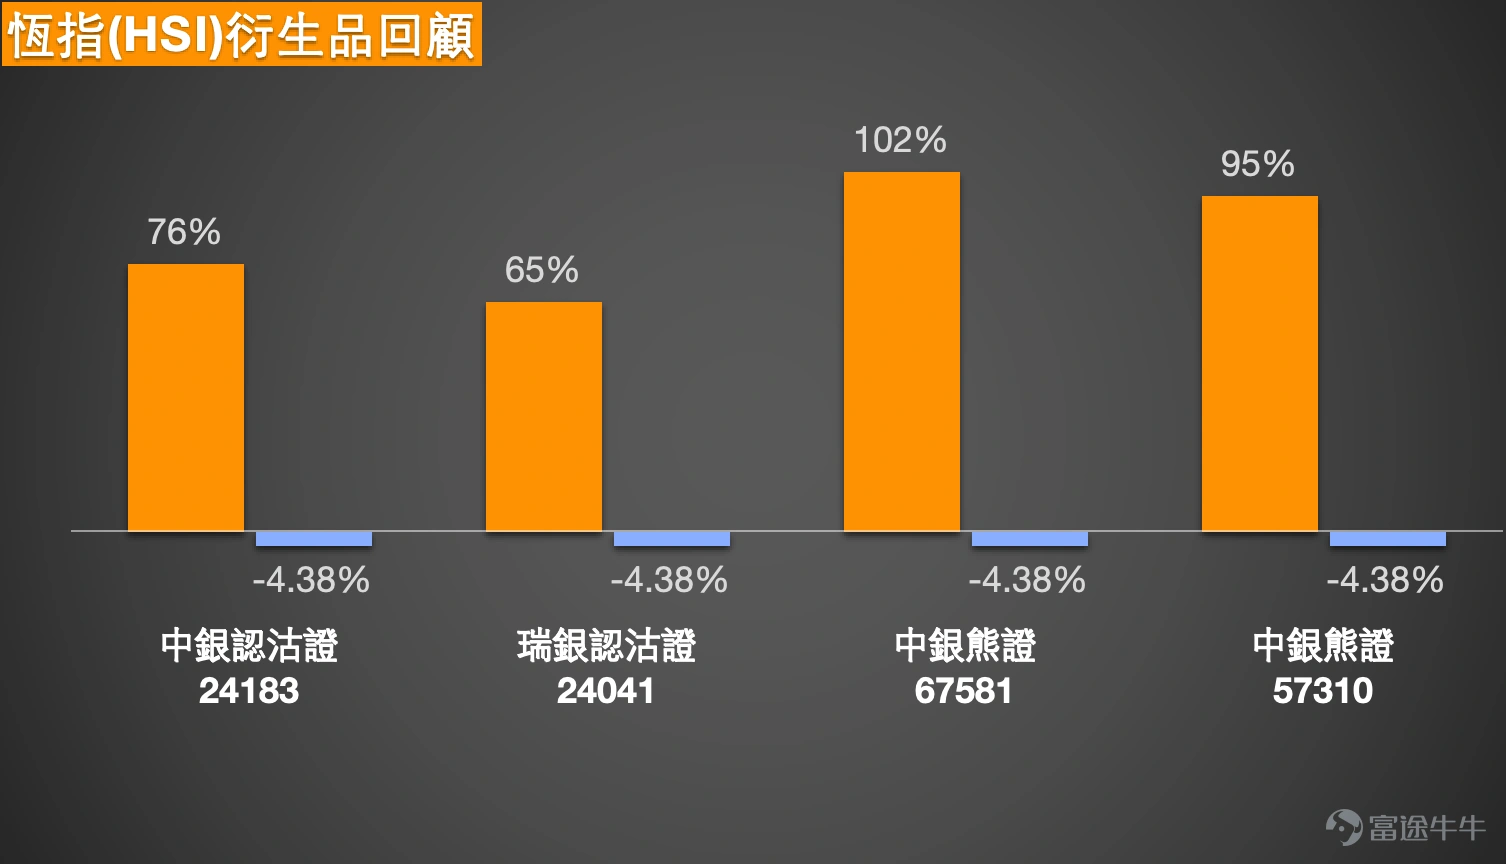
1. Hang Seng Index: Investors believe that today's large-volume decline has released bearish pressure. Near the left-side support, there is a possibility of stabilization. Bull certificates held overnight for a rebound have a recovery price at 24,200 points; some investors think that if buying bull certificates, a recovery price at 21,800 points would be safer; bearish investors expect further declines tomorrow to hit bull certificates at 24,000, holding bear certificates overnight.
The Hang Seng Index currently closed at 24,382 points, clearly breaking below the recent sideways trading range bottom and approaching previous low levels. Immediate visible support lies around 24,200 points, near the previous low of 24,203, with the next psychological support at the round number level of 24,000 points. On the upside, short-term resistance first needs to overcome 24,800 points, followed by the heavy trading zone between 25,200 and 25,500 points. Calculating from the current price to 24,800, the rebound potential is approximately 1.7%. However, if it breaks below 24,200, the downside testing to 24,000 or even lower will be about 1.5% to 2%, keeping the overall short-term volatility in the range of about 3% to 5%, but with an evident weak bias.
The moving average structure has turned into a clear downward arrangement, with all short and medium-term moving averages heading downwards, forming pressure, indicating that the dominant trend remains downward. The Relative Strength Index (RSI) is in the range of about 20 to 30, showing weakness and nearing oversold levels, but no significant divergence signal is seen yet. The Bollinger Bands have clearly expanded, with prices running close to the lower band, reflecting an accelerating downtrend rather than just fluctuations.
For an upward movement to happen, clear triggering conditions must appear: the index needs to first stabilize above the 24,200 support and rebound to reclaim above 24,500, along with the RSI rising from the lows to above 30, to challenge the 24,800 resistance. Otherwise, even if there is a rebound, it would only be a technical pullback with limited sustainability.
In terms of downside risk, once 24,200 is effectively broken and the market closes below it, a new round of selling pressure will be triggered, potentially leading to a rapid test of the 24,000 level or even further declines. Especially under the expansion of the Bollinger Bands, the probability of a continued downtrend is higher than an immediate reversal.
Observing the distribution of bullish and bearish warrant flows, trading is mainly concentrated in the bull warrants range of 24,000 to 24,500 and the bear warrants range of 25,500 to 26,000, indicating deployments on both sides of the market. However, the current price is approaching the dense area of bull warrants, implying risks of forced liquidations. Street inventory is also concentrated in the 24,000 to 24,500 bull warrants range, showing that many retail investors are betting on a rebound in this area, while bear warrants are focused at higher levels with no immediate pressure. Overall fund distribution shows separation between top and bottom, but in the short term, due to the price nearing the dense bull warrants zone, the market is actually tilted towards downside risk, without a consensus for a rebound.
Regarding investors' views that there may be a pause in decline near support after a heavy volume drop, this judgment is not entirely incorrect from a technical perspective because 24,200 is indeed a crucial short-term support level, and there could be a technical rebound. However, the problem lies in the clear downward trend, compounded by the price pressuring the bull warrants' forced liquidation zone. Once breached, the decline might accelerate instead. Therefore, holding overnight bull warrants with a strike price of 24,200 to bet on a rebound is a high-risk operation with low odds. As for choosing a strike price of 21,800, while providing a higher margin of safety, leverage and sensitivity would significantly decrease, possibly not meeting short-term deployment needs. On the other hand, the view of bearish investors expecting a breakdown below 24,000 and holding bear warrants is relatively reasonable given the current trend and structure, offering higher short-term odds if 24,200 is breached and the downtrend confirmed. $BI-HSI @EP2606B.P (24183.HK)$$UB-HSI @EP2606B.P (24041.HK)$$BI#HSI RP2804E.P (67581.HK)$$BI#HSI RP28042.P (57310.HK)$
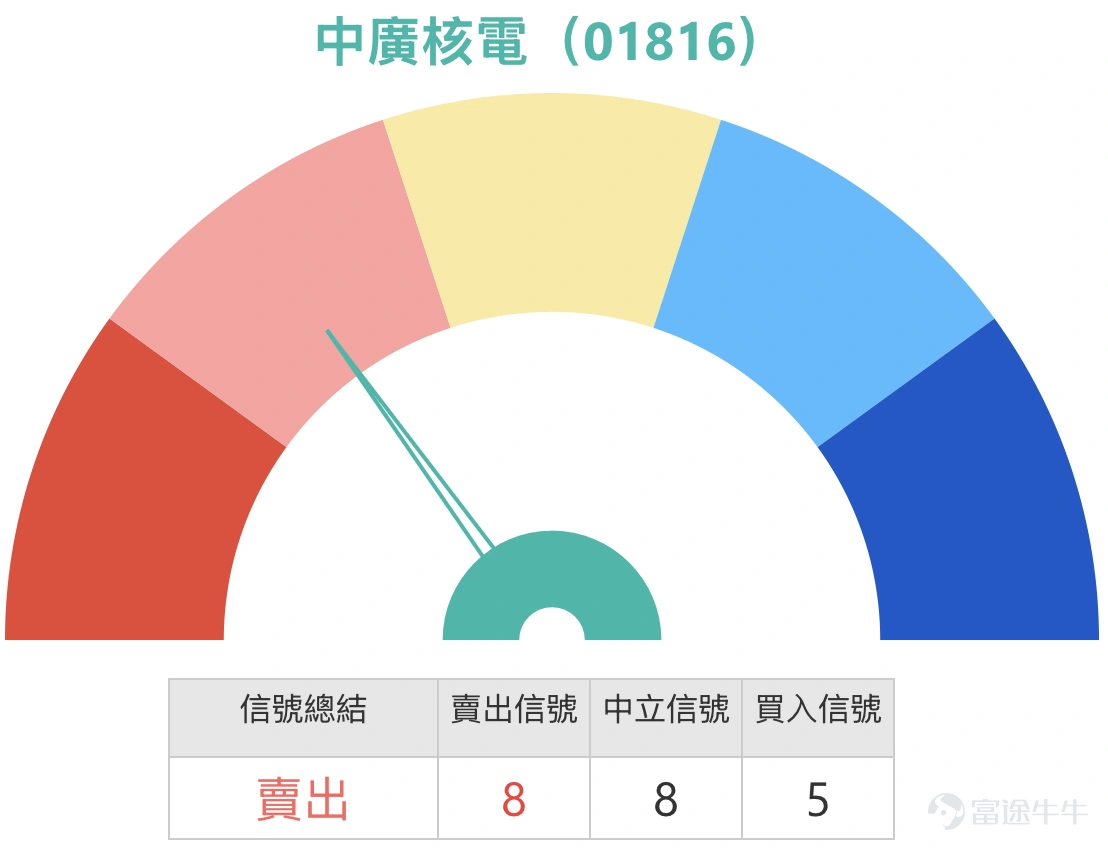
CGN Power (01816.HK): Today it performed strongly against the trend, reaching a 52-week high. Is there a chance to test 4 yuan?
CGN Power is currently trading at 3.49 yuan. The stock has been advancing along an uptrend and hitting a 52-week high, indicating a clearly strong upward pattern in the short term. Initial support is around 3.30 yuan, followed by 3.10 yuan, while there is no clear historical resistance above, with the psychological target set at 4.00 yuan. Based on the current price, the potential upside to 4.00 yuan is approximately 14.6%, while a pullback to 3.30 yuan would represent about a 5.4% drop. The overall trading range is roughly between 3.10 and 4.00 yuan, with volatility exceeding 25%. However, short-term fluctuations are primarily concentrated within a 5% to 10% range.
The moving averages show a clear upward alignment, with both short- and medium-term averages rising in sync and providing support, indicating strong trend continuation. The Relative Strength Index (RSI) is close to the 70 level, suggesting strength but nearing overbought territory, reflecting sustained inflows of capital but also accumulating short-term correction pressure. The Bollinger Bands are expanding, with the stock price running near the upper band, indicating that the uptrend is continuing but also implying that the short-term rise has been relatively sharp.
For further upward movement, clear triggering conditions are necessary: the stock price needs to stabilize effectively above 3.50 yuan and consistently close higher, accompanied by increased trading volume, to push prices towards 3.70 or even 4.00 yuan. If the price merely touches the upper band but fails to hold, there's a higher likelihood of consolidation at high levels.
In terms of downside risk, if the stock price falls below 3.30 yuan and closes beneath it, this will be seen as a short-term weakening signal, potentially triggering profit-taking pressure and testing support at 3.10 yuan. A break below 3.10 yuan would indicate structural damage to the uptrend, shifting the short-term trend from strong to neutral.
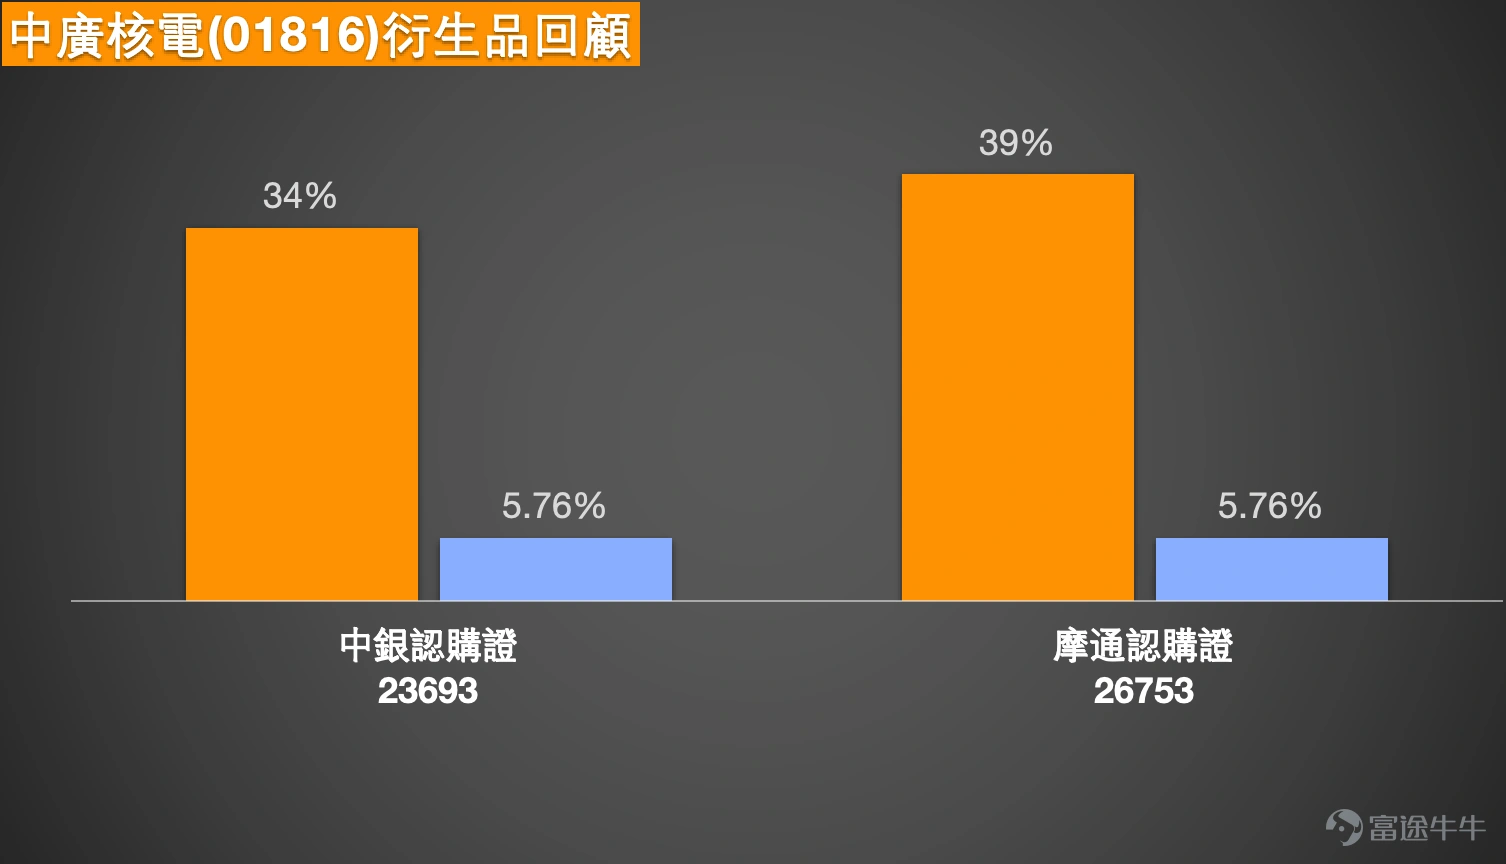
Observing the warrant flow distribution, the market is entirely focused on call warrants, with the most active trading concentrated in the strike price range of 3.40 to 3.60 yuan. Street inventory is also concentrated in this region, showing that investors generally expect the stock price to continue its upward trend. Since there is almost no deployment in put warrants, funds are unilaterally concentrated, indicating a clear bullish market sentiment. However, when call warrants become overly concentrated, any pullback in the underlying stock would simultaneously pressure the time value and price of related products.
Regarding investors' views on the possibility of testing 4 yuan, from a trend perspective, this target is not unreasonable since the stock is in an uptrend channel and hitting new highs, with market capital also predominantly bullish. However, it's important to note that the stock is now near the upper Bollinger Band and RSI is in a relatively high zone, reducing the short-term reward-to-risk ratio for chasing the uptrend. If the stock can stabilize above 3.50 yuan and maintain momentum, testing 4 yuan becomes feasible; otherwise, if it fails to hold or sees profit-taking, there’s a higher chance of consolidating gains in the short term. Thus, the current stage represents a strong but late-stage uptrend, where the reward-to-risk ratio is not optimal, requiring specific triggering conditions before making further moves. $BI-CGNP@EC2609A.C (23693.HK)$$JP-CGNP@EC2609A.C (26753.HK)$
3. Leapmotor (09863.HK): Investors noted that the trading volume is seven times the usual amount; is it still worth holding? Investors are focusing on call warrants with a strike price of 58.88 yuan.
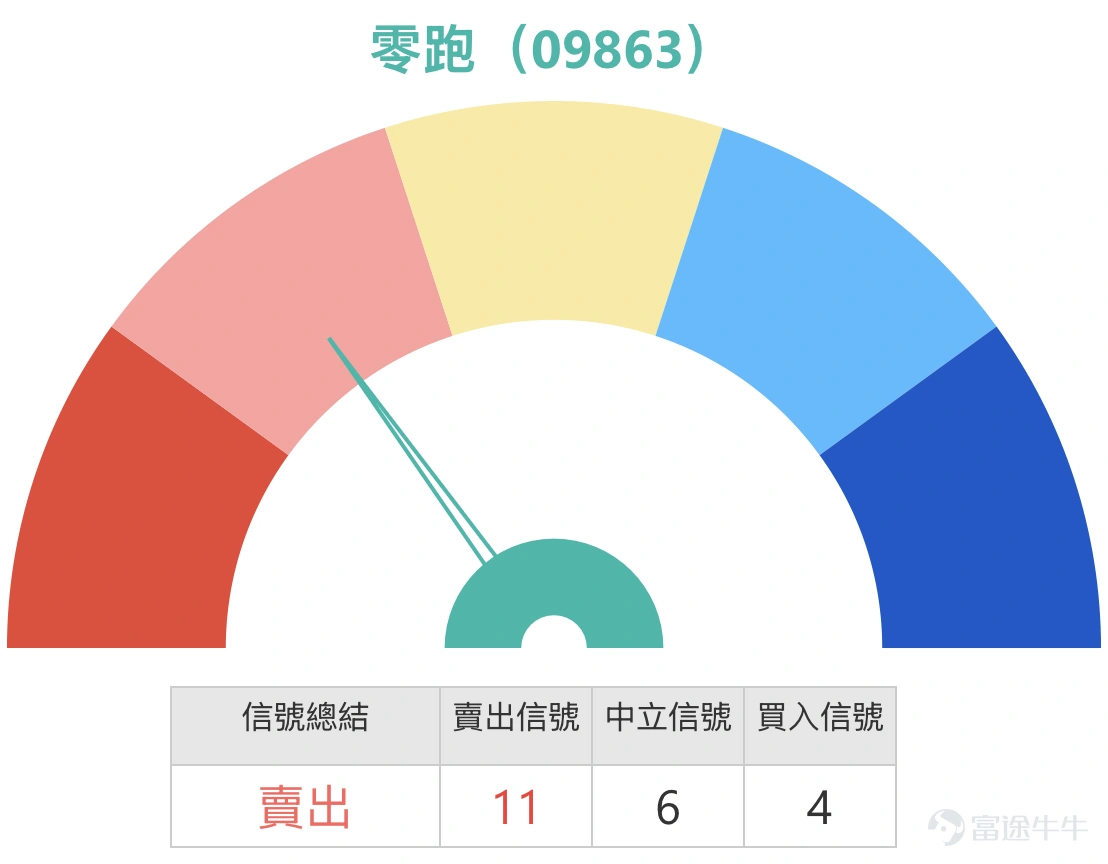
Leapmotor (09863) is currently priced at around 45.02 yuan, with its short-term trend in a consolidation phase following a rebound. The recent low was at 37.64 yuan, while the high reached approximately 50.65 yuan. At this stage, the main trading range falls between 42 to 46 yuan, with short-term volatility at about 8% to 10%. Initial support has formed around 42 yuan, while resistance lies above 46 to 47 yuan. Until a breakout occurs, the stock remains in a range-bound oscillation pattern.
In terms of moving averages, the medium- and long-term averages remain downward, reflecting that the overall trend has not completely reversed. However, short-term moving averages have started to converge and slightly flatten, indicating some return flow of short-term capital. The relative strength index (RSI) is in a relatively strong zone, staying above 60, showing that buying momentum persists but has not entered an extreme overbought condition. The Bollinger Bands have visibly narrowed, with the share price gradually approaching the upper band, signaling that the short-term movement is in a compression phase prior to choosing a direction. Once a breakout occurs, volatility could expand.
On the upside, it is crucial to watch for a breakout above the 46 to 47 yuan resistance zone. If the breakout can be accompanied by sustained increases in trading volume and stabilization above 47 yuan, then the breakout can be confirmed. In that case, there may be further upward testing toward the 48 to 50 yuan range. Conversely, if the breakout fails and the price retreats, breaking below the 42 yuan support will reopen downside risks, potentially retesting 40 yuan or even nearing the previous low.
From the perspective of capital structure, market trading activity is mainly concentrated in call warrants, with exercise prices clustered in the range of 58.8 to 66.7 yuan, indicating out-of-the-money positioning. This reflects that investors are inclined to bet on a continuation of the medium- to short-term rebound. However, open interest is concentrated in the higher 77 to 79 yuan range, suggesting that accumulated positions over the medium to long term remain skewed towards higher levels, posing potential supply pressure. The overall structure leans bullish, but follows an "out-of-the-money chasing" pattern rather than value accumulation at lower levels, indicating aggressive but potentially unstable market sentiment.
Regarding the investor's mention of trading volume increasing to seven times the usual amount and considering whether to continue holding, as well as holding call warrants with a strike price of 58.88 yuan, this view requires cautious consideration. Increased trading volume indeed indicates rising investor attention, but before key resistance levels are broken, higher volumes might simply reflect short-term profit-taking or divergence at higher levels. The current price is still about 30% away from 58.88 yuan, representing a clear out-of-the-money structure. If the share price fails to quickly break through and extend its upward trend, time decay will significantly erode returns.
In terms of short-term attractiveness, this is a phase of being "close to resistance without confirmed breakout," with the risk of holding at elevated levels rising. If the stock price fails to effectively break through 47 yuan and stabilize above it, continuing to hold such out-of-the-money call warrants offers poor value. On the other hand, only after a confirmed breakout and extended upward trend does holding become justifiable. Therefore, while the investor’s optimistic outlook has some basis, it currently lacks technical structural support, making it an aggressive position that requires strict risk control.
Reminder: This article does not constitute any investment advice.
This article is for reference only and does not constitute any investment advice. The market data, opinions, and analysis contained herein may change at any time without prior notice. We are not responsible for any loss or damage caused by reliance on the information in this article. Technical analysis only shows whether certain technical conditions are met; a comprehensive assessment of asset performance should combine other data and should not solely rely on this article to make trading decisions. Please note that past performance is not indicative of future results. Follow Jenny's insights on Hong Kong stock warrants for more professional analysis.
Risk Disclaimer: The above content only represents the author's view. It does not represent any position or investment advice of Futu. Futu makes no representation or warranty.Read more

Comments
to post a comment
1
11