English
Back
Open Account
Earnings reports from Chinese giants raise concerns! Is it a good time to buy on dips?

港股窩輪Jenny
joined discussion · Mar 24 09:13

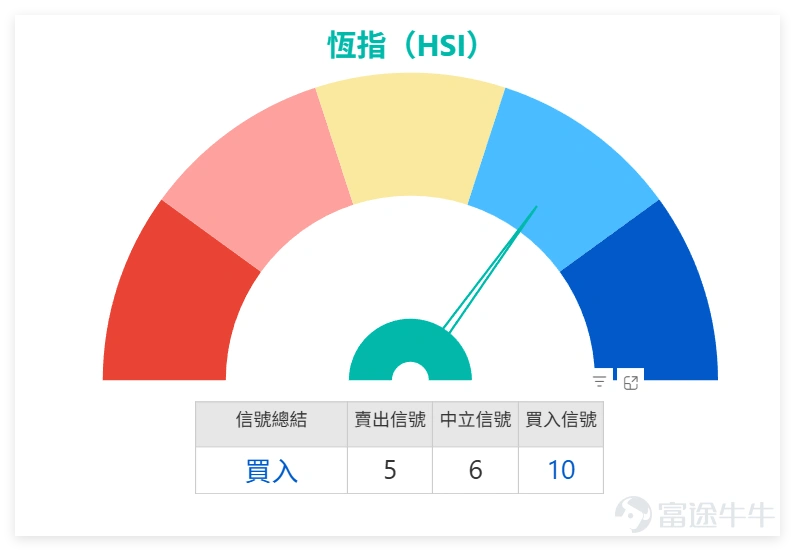
The Hang Seng Index technical indicators collectively signal 'buy,' suggesting the market may be approaching a short-term rebound window.

The previous trading day (March 23) $Hang Seng Index (800000.HK)$
The Hang Seng Index closed at 24,382.47 points, down 3.54% in a single day, with a turnover of 368.677 billion yuan. Although the index plummeted, technical indicators summarized a 'buy' signal with an intensity as high as 10, showing significant divergence from price movements.
On the previous day (March 23rd)$Hang Seng Index (800000.HK)$ The index closed at 24,382.47 points, down 3.54% on the day, with a trading volume of 368.677 billion yuan. Despite the sharp drop in the index, the technical indicators collectively signaled 'buy' with a strength as high as 10, showing significant divergence from the price movement. Specifically, the Williams %R indicator is already in an oversold condition, the CCI indicator provided a buy signal within the oversold range, and the Ichimoku Cloud also suggests that a bottom may form after the sharp decline. Additionally, the momentum oscillation indicator showed a bottom divergence buy signal. Although trend-based signals like MACD and Bollinger Bands still indicate sell, overall, multiple oscillation-based indicators are showing highly concentrated oversold signals, hinting that the one-sided downtrend might be nearing its end. In terms of key levels, the first support for the Hang Seng Index is currently at 23,862 points, and the second support is at 23,118 points. The subsequent trend will need to closely observe the support level at 23,862 points, which will be the short-term critical point to judge whether the market can successfully bottom out. Above, resistance levels can be watched at 25,367 points and 26,503 points. Although all key blue chips fell sharply the previous day, combining technical indicator analysis revealed a rare collective 'price-falls-signal-buys' divergence pattern, broken down as follows: 1. Severely oversold stocks: $BABA-W (09988.HK)$Closed at 119.7 yuan, down 3.23%, with RSI dropping to 28 and a buy signal strength of 11. $PING AN (02318.HK)$The closing price was 57.5 yuan, down...
Looking at specific indicators, the Williams %R is already in an oversold condition, the CCI indicator gives a buy signal within the oversold range, and the Ichimoku Cloud suggests possible bottoming after an excessive decline. Additionally, the momentum oscillator showed a bullish divergence buy signal. While trend-based signals like MACD and Bollinger Bands remain sell signals, overall, multiple oscillators are strongly signaling oversold conditions, hinting that the one-sided downtrend may be nearing its end.
In terms of key price levels, the first support level for the Hang Seng Index is currently at 23,862 points, with the second support level at 23,118 points. The subsequent trend will need to focus on the strength of support at the 23,862-point level, which will be the short-term key to determining whether the market can successfully form a bottom. Resistance above can be watched at 25,367 points and 26,503 points.
Although all key blue chips fell across the board on the previous trading day, combining technical analysis reveals a rare collective 'price drop but buy signal' divergence pattern, broken down as follows:
1. Severely oversold stocks:
$BABA-W (09988.HK)$ Closed at 119.7 yuan, down 3.23%, RSI dropped to 28, with a buy signal strength of 11.
$PING AN (02318.HK)$ Closed at 57.5 yuan, down 6.88%, RSI dropped to 29, with a buy signal strength of 11.
$HKEX (00388.HK)$ Closed at 382.6 yuan, down 3.38%, RSI dropped to 31, with a buy signal strength of 11.
Commonality: All three RSIs have entered the severely oversold zone, indicating an extremely strong rebound demand.
2. Approaching oversold stocks:
$TENCENT (00700.HK)$ Closed at 498.4 yuan, down 1.89%, with RSI dropping to 34, indicating a strong buy signal.
$MEITUAN-W (03690.HK)$ Closed at 76.55 yuan, down 3.28%, with RSI dropping to 37, indicating a strong buy signal.
$HSBC HOLDINGS (00005.HK)$ Closed at 118.9 yuan, down 4.50%, with RSI dropping to 37, indicating a strong buy signal.
3. Moderately weak stocks:
$XIAOMI-W (01810.HK)$$AIA (01299.HK)$$CCB (00939.HK)$$CHINA MOBILE (00941.HK)$ RSI for these stocks is in the moderately weak range of 39-44, but clear buy signals indicate that downward momentum is gradually easing.
Core conclusion: Although the closing prices of all key blue chips remain below major moving averages and trends are weak, every single one has generated a 'buy' signal. This broad-based and high-intensity divergence between price declines and buy signals strongly suggests that conditions for a short-term technical rebound in the market are highly mature.
Review and Selection of Warrants and Bull/Bear Contracts
Previous review:
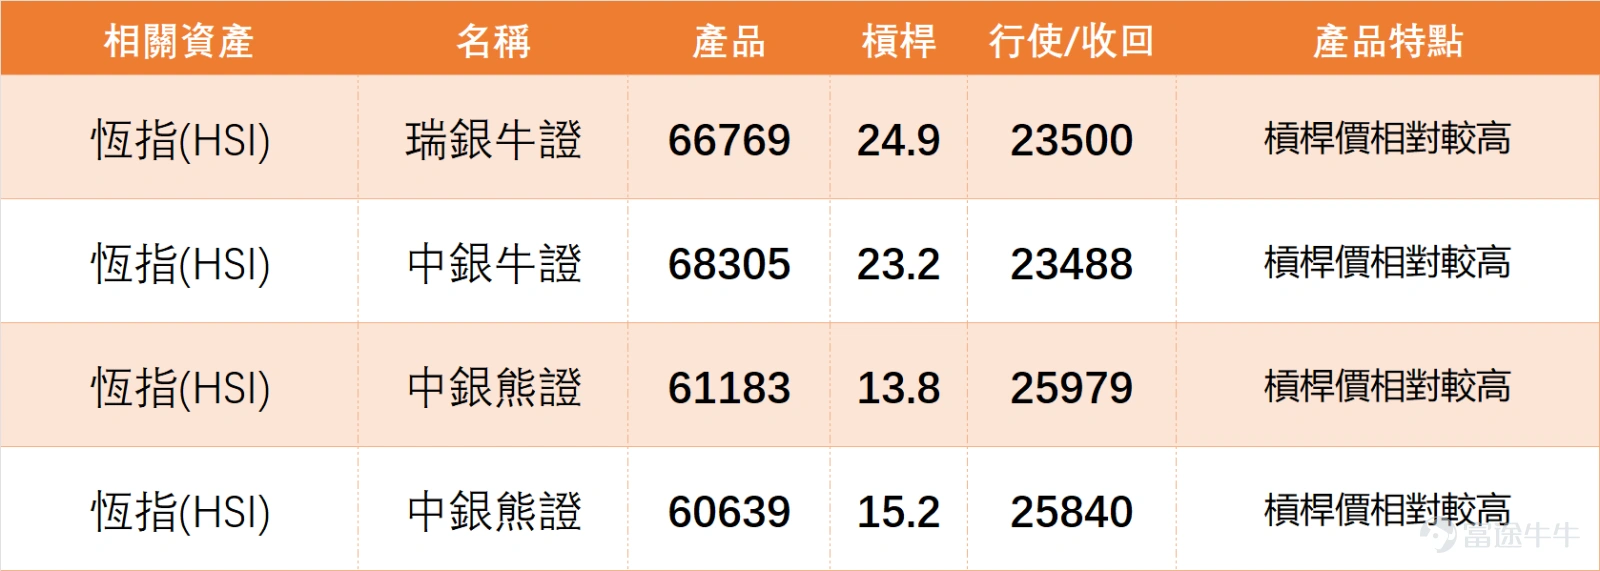
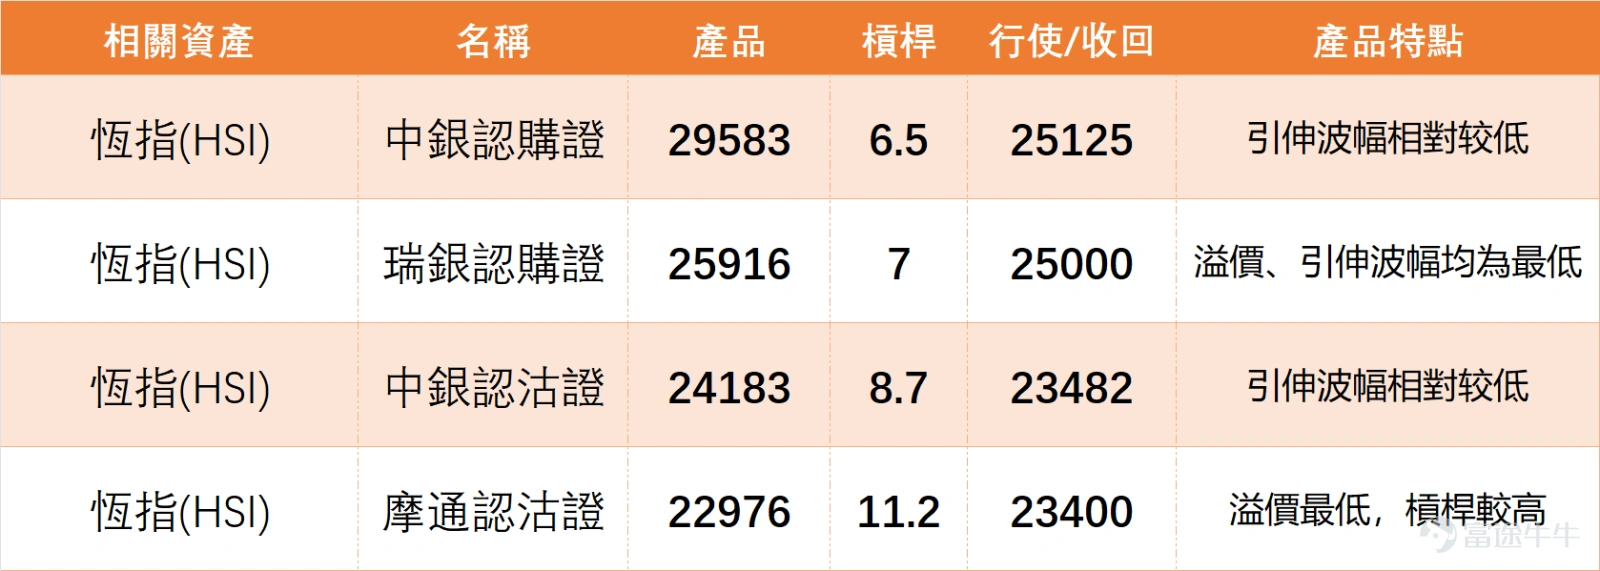
The Hang Seng Index put warrants recommended on March 17 performed exceptionally well, with $JP-HSI @EP2605A.P (22976.HK)$ a two-day increase of 27%, $BI-HSI @EP2606B.P (24183.HK)$ and another with a two-day increase of 19%, precisely aligning with the Hang Seng Index's recent adjustment trend.
On the previous day (March 23rd)$Hang Seng Index (800000.HK)$ The index closed at 24,382.47 points, down 3.54% on the day, with a trading volume of 368.677 billion yuan. Despite the sharp drop in the index, the technical indicators collectively signaled 'buy' with a strength as high as 10, showing significant divergence from the price movement. Specifically, the Williams %R indicator is already in an oversold condition, the CCI indicator provided a buy signal within the oversold range, and the Ichimoku Cloud also suggests that a bottom may form after the sharp decline. Additionally, the momentum oscillation indicator showed a bottom divergence buy signal. Although trend-based signals like MACD and Bollinger Bands still indicate sell, overall, multiple oscillation-based indicators are showing highly concentrated oversold signals, hinting that the one-sided downtrend might be nearing its end. In terms of key levels, the first support for the Hang Seng Index is currently at 23,862 points, and the second support is at 23,118 points. The subsequent trend will need to closely observe the support level at 23,862 points, which will be the short-term critical point to judge whether the market can successfully bottom out. Above, resistance levels can be watched at 25,367 points and 26,503 points. Although all key blue chips fell sharply the previous day, combining technical indicator analysis revealed a rare collective 'price-falls-signal-buys' divergence pattern, broken down as follows: 1. Severely oversold stocks: $BABA-W (09988.HK)$Closed at 119.7 yuan, down 3.23%, with RSI dropping to 28 and a buy signal strength of 11. $PING AN (02318.HK)$The closing price was 57.5 yuan, down...
Product Picks:
Based on the current expectation of an oversold Hang Seng Index at its bottom, here are two selected warrant products for reference:
1、 $UB-HSI @EC2612A.C (25916.HK)$: Leverage of 7x, strike price at 25,000 points, with the lowest premium and implied volatility in its category; suitable for investors who are optimistic about a short-term rebound in the Hang Seng Index and seek stable swing trading gains.
2、 $BI#HSI RC2801D.C (68305.HK)$: Leverage of 23.2x, recovery price at 23,488 points, higher leverage that aligns with swing trading to capitalize on an oversold rebound in the Hang Seng Index; highly flexible.
On the previous day (March 23rd)$Hang Seng Index (800000.HK)$ The index closed at 24,382.47 points, down 3.54% on the day, with a trading volume of 368.677 billion yuan. Despite the sharp drop in the index, the technical indicators collectively signaled 'buy' with a strength as high as 10, showing significant divergence from the price movement. Specifically, the Williams %R indicator is already in an oversold condition, the CCI indicator provided a buy signal within the oversold range, and the Ichimoku Cloud also suggests that a bottom may form after the sharp decline. Additionally, the momentum oscillation indicator showed a bottom divergence buy signal. Although trend-based signals like MACD and Bollinger Bands still indicate sell, overall, multiple oscillation-based indicators are showing highly concentrated oversold signals, hinting that the one-sided downtrend might be nearing its end. In terms of key levels, the first support for the Hang Seng Index is currently at 23,862 points, and the second support is at 23,118 points. The subsequent trend will need to closely observe the support level at 23,862 points, which will be the short-term critical point to judge whether the market can successfully bottom out. Above, resistance levels can be watched at 25,367 points and 26,503 points. Although all key blue chips fell sharply the previous day, combining technical indicator analysis revealed a rare collective 'price-falls-signal-buys' divergence pattern, broken down as follows: 1. Severely oversold stocks: $BABA-W (09988.HK)$Closed at 119.7 yuan, down 3.23%, with RSI dropping to 28 and a buy signal strength of 11. $PING AN (02318.HK)$The closing price was 57.5 yuan, down...
Risk Warning: Warrants and callable bull/bear contracts are high-leverage derivatives with significant volatility. Investors must operate cautiously based on their risk tolerance and strictly control position sizes.
The Hang Seng Index is showing an oversold signal, with all blue chips indicating 'buy'. Would you choose to take advantage of the dip or continue to wait and see? Feel free to share your thoughts in the comments section. For more market analysis, stay tuned to 'HK Stock Warrants Jenny' for daily updates!
Reminder: This article does not constitute any investment advice.
This article is for reference only and does not constitute any investment advice. The market data, opinions, and analysis contained herein may change at any time without prior notice. We are not responsible for any loss or damage caused by reliance on the information in this article. Technical analysis only shows whether certain technical conditions are met; a comprehensive assessment of asset performance should be conducted using additional data. Decisions to trade should not be based solely on this article. Please note that past performance is not indicative of future results.
#HongKongStocks #HangSengIndex #RealTimeAnalysis #WarrantsSelection #WarrantsStrategy #DerivativesHedging #HongKongWarrantsJenny #Tencent #BlueChipStocks #TechnicalAnalysis
Risk Disclaimer: The above content only represents the author's view. It does not represent any position or investment advice of Futu. Futu makes no representation or warranty.Read more
Thumbs Up
5
Respect
1
324K Views
Report
Comments (5)
Write a Comment...
5
6